



When it’s the height of summer in the northern hemisphere, markets tend to be drowsy. The World Cup is on in the US. England, France and Spain are in the semis. So no one is really focused on markets right now.
As a result, the Aussie market has been directionless. At least, that’s how it has seemed.
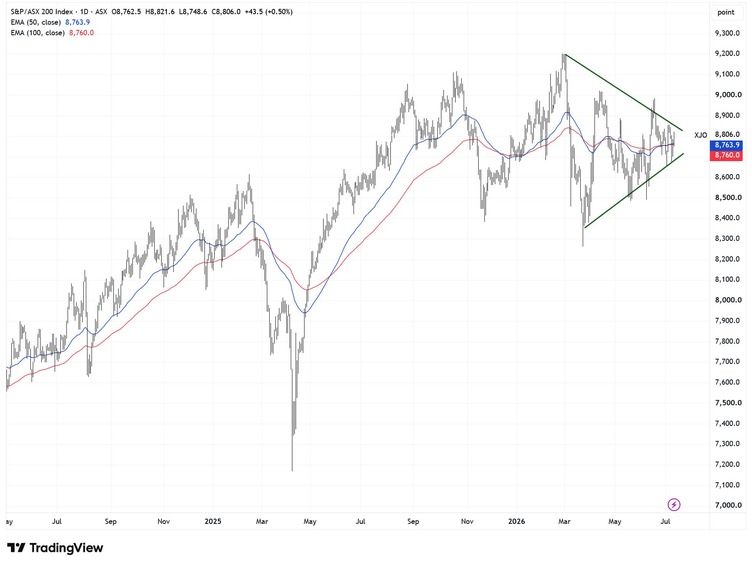
But a look at the chart of the ASX200 below suggests a decision point is approaching. Since hitting all-time highs in early March, the ASX200 plunged on the outbreak of the US/Iran war.
It’s since recovered, but it has been indecisive about it. In the next month or so, the market is likely to break either way.
A move higher would be the result of valuation-agnostic passive flows and the prospect of lower interest rates. A move lower would be the result of…take your pick…
Source: TradingView
[Click to open in a new window]
More immediately, you’d have to think the ongoing war in the Middle East and the impact on energy prices will weigh on markets.
Predictably, the war picked up a notch over the weekend, but at the time of writing (before the market has opened) there hasn’t been a Trump post saying ‘negotiations are going well’, or that ‘Iran is desperate for a deal’.
Bloomberg reports…
The US struck Iran for a third time in a week, prompting retaliatory attacks on at least five Arab nations as Washington and Tehran issued conflicting declarations over whether the Strait of Hormuz remains open to shipping.
The Islamic Republic responded early Sunday with drone and missile assaults on American allies across the Middle East, including Kuwait, Jordan and Qatar. So far, only minor damage was reported and no casualties.
Iran said the Hormuz strait would now be closed “until further notice.” US Central Command denied that, saying that waterway was still open to all vessels and the US military is prepared to ensure freedom of navigation.
Both sides are claiming control of the strait. Who knows what the reality is. Up until very recently though, the market had grown very complacent about global energy supplies, pushing brent crude prices down to the low US$70/bbl range.
The current supply/demand picture is not representative of a normal market. The US continues to draw on its strategic petroleum reserves, while China remains largely absent from the market.
Prior to the war, China’s imports of crude were around 11-12 million barrels per day. After the war started, its imports halved to 5.9 million barrels a day in June. They have since rebounded but remain well below pre-war levels.
I don’t know where the oil price should be after taking everything into account. But if Iran continues to impact flows through the Strait of Hormuz, I think it’s higher than the current price of US$78.50/bbl.
I’m not suggesting it will be US$100/bbl plus. But US$80-90/bbl given the risks around Hormuz seems reasonable.
The US can’t keep drawing down reserves indefinitely, and while China’s ongoing sustainable consumption might be lower than pre-war levels (it has been over-importing to build reserves for years), it will come back to the market in the months to come.
The energy question is important because of its impact on inflation expectations. The recent oil price decline took pressure off government bond yields, which in turn boosted equity markets.
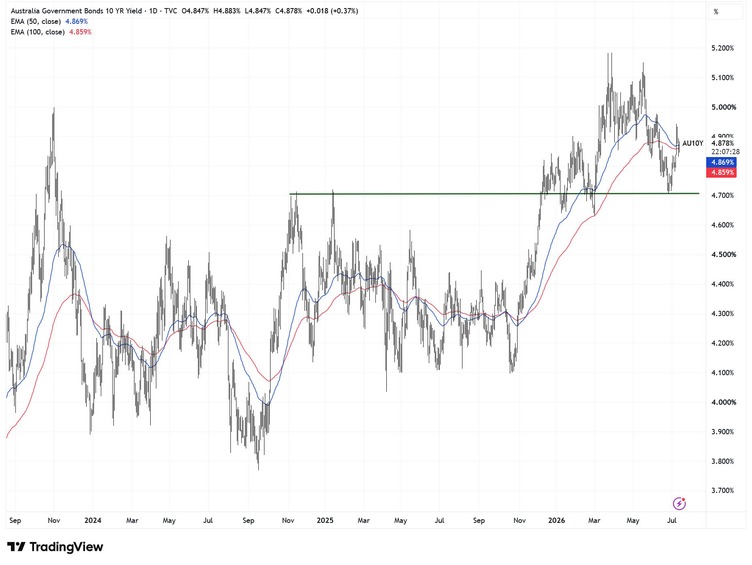
This was especially the case in Australia. The 10-year bond yield fell from a peak of around 5.10% in March and May to 4.7% in late June as oil prices plunged.
Yields have since risen back to 4.87% as energy prices increase again. As you can see in the chart below, the 10-year bond yield remains in an upward trend.
If yields move to new highs in the months ahead, you would think the ASX200 will break down out of the consolidation pattern I showed you earlier. It’s too expensive to hold up if yields push into the 5% range again.
Source: TradingView
[Click to open in a new window]
As always, this warning comes with nuance. ‘The market’ is heavily dominated by expensive large caps.
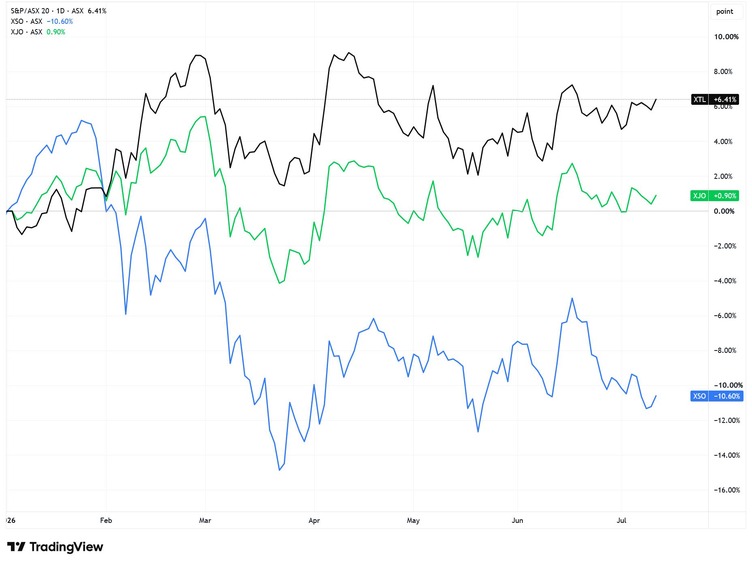
The chart below shows the 20 largest companies on the ASX (ASX20) in black. They’re up 6.4% so far this year. The ASX200 (green line) is up just 0.9%. The Small Ords index (blue line) is down 10.6%.
Source: TradingView
[Click to open in a new window]
So when I say ‘the market’ is overvalued, I’m mostly referring to the largest stocks. That’s where big money goes to hide when it’s worried.
And with annual reporting season getting underway next month, capital looks like it is seeking refuge in the large caps.
The stretched valuations of the banks are well known. BHP and Rio are also stretched after experiencing strong share price gains over the past 8-12 months.
But there are others…
Telstra trades on 23 times forward earnings. The market clearly isn’t worried about the impact of SpaceX’s Starlink!
Macquarie Bank on 19.5 times forward earnings…
Goodman Group on 22 times…
Wesfarmers on 34 times…
And who knew defensive food staples were growth stocks…Woolworths trades on 29 times earnings, and Coles trades on 24 times earnings.
P/E ratios aren’t everything. But they are a decent shorthand way to gauge value. These numbers look crazy to me.
In investing, you tend to pay a high price for certainty. Institutional money is attracted to these companies because the perception of earnings risk is low.
When the perception of risk is low, actual risk is often at its highest. All it takes is a worse-than-expected earnings announcement from these companies, and the share price will be hit hard. That’s what happens when low perceived risk turns into actual risk.
The price of admission into the equity market is volatility and uncertainty. Everyone pays that price. There is no escaping it. It’s what you get in return that makes it worthwhile.
Right now, it looks like there is a lot of capital trying to avoid that inevitable impost. In the long term, they will probably pay double.
Regards,

Greg Canavan,
The Insider



Comments