



“He who lives by the crystal ball soon learns to eat ground glass.”
— Economist, Edgar R. Fiedler
At the end of this, I’ll give you a fresh ‘prediction’ from ATLAS. Though as you’ll see, that’s not quite the right word.
Predictions are a dangerous game.
Especially if you’re busy looking far out to the horizon.
Just ask any economist who’s predicted nine of the last five recessions.
Fiedler’s quote above is my favourite from the field. It comes from his hilariously scathing journal article, published back in 1977 after his time as Assistant Secretary of the Treasury.
His piece spawned many of the timeless quotes — including its title:
‘The Three Rs of Economic Forecasting: Irrational, Irrelevant, Irreverent.’
His main argument is that economic forecasting is:
- Irrational because it attempts to use rigid mathematics to model chaotic human behaviour
- Irrelevant because by the time the long-term forecast is delivered, the underlying facts on the ground have changed
- Irreverent because the market has no respect for the predictions or the Ivy League-types that spawn them
The best advice from his piece is this: ‘If you have to forecast, forecast often’.
That’s the thinking behind ATLAS, the system I built here at Fat Tail.
It doesn’t forecast. It observes. Every morning, it tracks where money is flowing on the ASX.
The forecasting is left to you. But when your observations are fresh every day, your forecasts can be too.
As I tell folks, we’re not in the predicting game; we’re in the observing game.
To see what I mean, I thought I’d give you a peek behind the curtain at an early signal ATLAS caught this week.
But before we get there, let’s lay the table a bit.
Small Caps have been Smashed
This is far from a revelation; many of you are likely bleeding in parts of your portfolio.
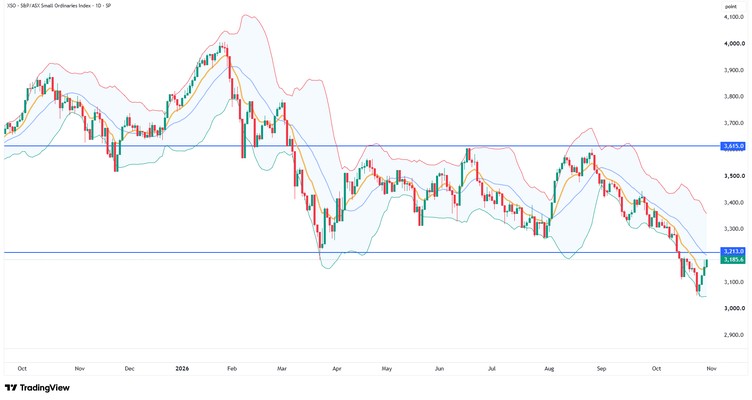
But this point is worth underscoring for those of you who aren’t into the weeds. The Small Ords Index (XSO) has seen a recent capitulation event, falling out of its range to a low of nearly 25% off its high.
As you can see below, the Small Ords are now seeing money flow back into the deep value that can be found there.
Source: TradingView
[Click to open in a new window]
But before we get to the opportunity, a bit more on the pain. With another strong inflation reading this week (Headline CPI rose 4.3% from 4%), the chief culprit isn’t hard to find.
High diesel prices stemming from the Iran conflict are the top headache, with Brent crude trading around US$114 per barrel.

Source: ABS
[Click to open in a new window]
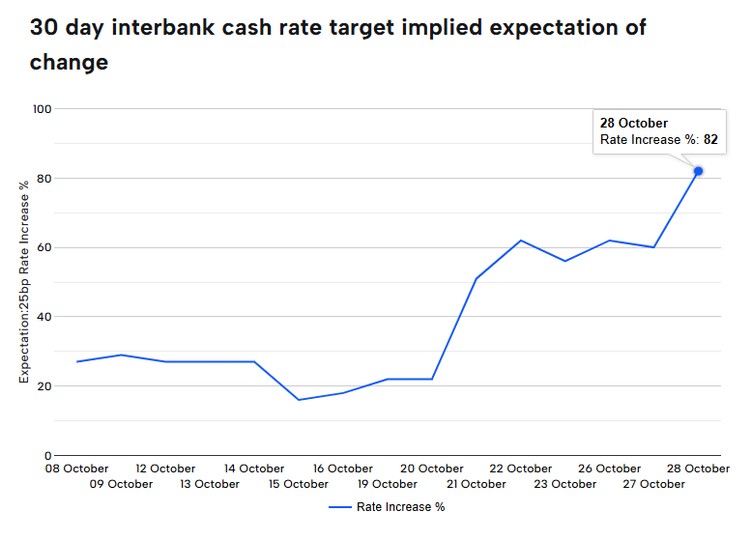
Just like the punters on Melbourne Cup Day, the market is now backing the clear favourite of another rate hike coming down the inside lane.
Just two weeks ago, the market’s best guess of where interest rates are heading gave only a 16% chance of a rate hike.
Now the tune has changed after a hot CPI and a relentless two weeks of warnings from senior RBA officials.
Not exactly forward guidance in the old sense, but something that former Reserve Bank insider Luci Ellis described as ‘open mouth operations’.
Source: ASX
[Click to open in a new window]
So what’s the takeaway from all this?
Surely the answer isn’t you wasting your time listening to RBA speeches to get the latest macro outlook — which, as we covered earlier, is likely wrong or irrelevant.
You don’t have to be like me and suffer through RBA fireside chats to understand where things are heading.
Let ATLAS be Your Map
On ATLAS, the signs of a rate rise were clear well before interbank futures moved.
To be clear, ATLAS doesn’t read the news or predict where interest rates are heading next.
But looking at the sectors that are worst hit by higher rates, you could easily see which sectors money was avoiding.
Real estate, tech, and small-cap telcos have shared the bottom of the sector rankings since the 6th of October.
A clear signal you can read with one click as you enjoy your morning coffee.
Yet the places to avoid are just one part of the full ATLAS package. What’s far more exciting is where money is heading next.
As I mentioned earlier, the small caps have copped a beating recently, and there are few headlines telling you what’s next. There are two good reasons for this.
Going back to the beginning, the first is the perils of predictions.
No one wants to stick their neck out and fail at a prediction that’s outside of the ‘norm’.
As Keynes put it:
‘Worldly wisdom teaches that it is better for reputation to fail conventionally than to succeed unconventionally.’
‘A sound banker, alas is not one who foresees danger and avoids it, but one who, when he is ruined, is ruined in a conventional and orthodox way along with his fellows, so that no one can really blame him.’
The second challenge is just the sheer speed of information.
Writing articles takes time, and there is only so much one can read on the other end.
Today, algorithms determine the news, and algorithms move the markets faster than any of us can handle.
By the time you update your watchlist, the current hot sector has already moved on.
Snapshot from ATLAS
So, here’s that ‘prediction’ I promised. Or, more accurately, what ATLAS is observing right now: Rare Earths.
After a year of relative quiet between the US and China, the rare earths sector has been crushed. Global ETFs covering the theme are down between 20% and 30% this year.
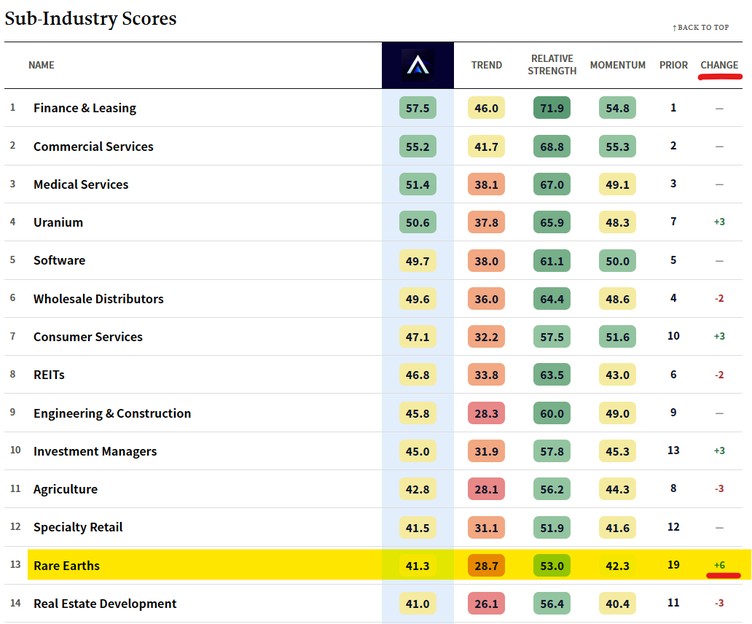
But yesterday, ATLAS saw its biggest jump in that subsector in some time.
If you’re unfamiliar, ATLAS is a system that scans the market for momentum, showing where money is flowing in and out.
It’s focused on the small end of the market, tracking and scoring stocks, sectors and subsectors. Below is part of its subsector view:
Source: ATLAS 1.0
[Click to open in a new window]
If you’d asked me at the end of last week what to watch, I’d have said Uranium stocks, but those have already had a week of bouncing off their lows.
There may still be opportunities there. But I promised you something the headlines haven’t caught up with yet.
ATLAS suggests both uranium and rare earths may be in the early stages of a recovery.
That doesn’t mean everything is a buy; you’ll still need to do your research (note the trend scores are still poor).
But within this snapshot, you can see where the money is starting to flow.
This is, of course, just one picture in a rapidly moving market. If you want to learn how to get access to the updates every morning, join me as I explain the system in more detail.
Regards,
Charlie Ormond,
ATLAS and Altucher’s Investment Network Australia
PS: The full ATLAS 1.0 demo is now available as a transcript. Skip straight to the Top 10 if you like. We won’t tell. [Read it here]




Comments