




Earlier this month, oil saw its third sustained breakout above US$100 in 2026 after the escalation in the conflict between US, Israel and Iran. The latest comes as the Iranian regime attacked commercial vessels, struck oil facilities and US military installations in neighbouring Gulf nations, and the Houthi rebels seized Perim Island off the coast of Yemen, threatening shipping at the Red Sea.
This renewed escalation has once again raised concerns that the conflict will plunge the global economy. Many market observers are tracking the impact of the supply chain disruption, especially on fuel, petroleum products, chemicals, and fertilisers, signalling that things are on the brink unless the conflict ends soon.
The general market consensus is one of pessimism, and justifiably so. Some are expecting a sharp global recession while others are invoking a repeat of the 1970s Oil Crisis.
Could these happen? Quite possibly.
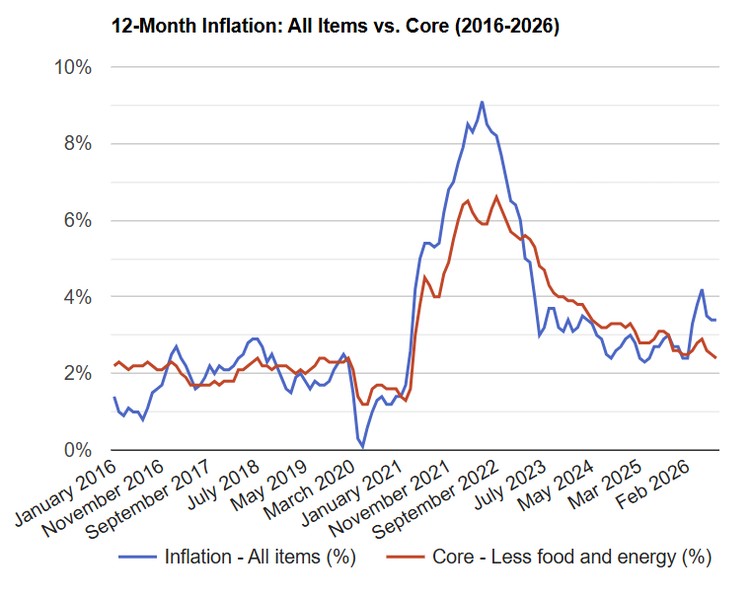
But if that is the case, the US inflation data doesn’t seem to support this. At least not yet. Based on the most recent CPI data released last Friday, the year-on-year headline CPI rate sits at 3.4%. Most notably, gasoline prices contributed to a third of the price increase, being up 3.9% in August and 16.1% in the past year.
Despite the headline number exceeding consensus estimate, this is below the 4.2% reading in May, and well below the June 2022 peak of 9.1%:
Source: US Inflation Calculator
[Click to open in a new window]
Setting aside the hype in the current headlines, let’s examine further why the reality may feel dire while the data suggest otherwise. We’ll attempt to reconcile the discrepancies, determine what is real, and how to position ourselves in this unfolding situation.
2022 – The oil shock hits a weak
yet overheated economy
Recency bias leads people to place a greater weight on what we’re feeling now than in the past. That’s because the lived reality is more striking than our memories.
This is playing out right now. Prices are rising when we go to the grocery stores, dine out, fill up our car, and pay the bills. These are undeniable facts. We can’t dismiss them, nor do we need to.
However, we can evaluate the data and use it to reach a more objective conclusion.
Let’s start with oil:
[Click to open in a new window]
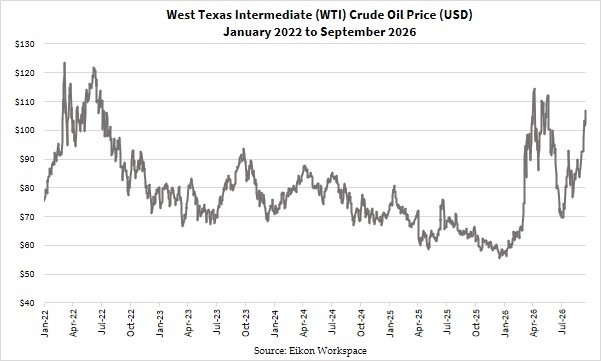
The WTI oil started at US$75 a barrel at the start of 2022. It was trending higher after the world began to reopen and industries increased their demand for oil while the global supply chain was feeling the strain caused by the lockdowns. As the Russia-Ukraine conflict erupted, oil prices jumped quickly to over US$100 per barrel and then breached US$120 following Western sanctions on Russian oil exports.
The oil price dropped temporarily after the first spike driven by the draining of the US Strategic Petroleum Reserves to increase supply to stem the rally. However, oil rebounded after hitting US$95 and made a second run above US$120 by June. By this time, inflation had peaked as the economy reached a breaking point. Businesses and consumers felt the strain and therefore reduced their activities. This helped to bring oil down for the rest of 2022, and it remained below US$100 until early 2026.
Oil wasn’t the sole driver for inflation in 2022. The US Federal Reserve also contributed to this by firstly missing the chance in 2021 to control inflation, calling it ‘transitory’. It subsequently recognised it was slow off the mark and announced its first rate rise in the March meeting, shortly after oil spiked. It then continued raising interest rates aggressively, by as much as 0.75% for the June, July, September and November meetings.
Monetary policy works with long and variable lags. Higher rates can restrain investment and other interest-sensitive components of demand before the full effect of tighter financial conditions is reflected throughout the economy. In 2022, however, the Fed was trying to cool an economy already dealing with extraordinary supply constraints and an inflation surge.
The US economy, and the broader global economy for that matter, only started to recover in late-2023, months after the US Federal Reserve made the final rate hike of the cycle in the July meeting.
2026: The oil shock hits an economy emerging
from a prolonged tightening cycle
Looking at this year, the situation is quite different.
The US economy experienced a period of tightening during the rate-hike cycle, bringing inflation down to below 4% since mid-2023. The Federal Reserve had been cutting interest rates from September 2024 until December 2025, without stoking inflation. The domestic economy was beginning to show signs of recovery, without the risk of overheating.
On the energy front, oil prices had been declining while US oil production strengthened. According to the US Energy Information Administration, the US produced an average of 11.9 million barrels of oil per day in 2022. This increased by 17% to almost 13.9 million barrels a day in the first week of September this year, and is estimated to remain at 13.8 million barrels a day for the rest of the year. The operation against Venezuelan President Nicolas Maduro in early January strengthened its oil supply, at one stage adding 800,000 barrels a day to the US.
Combining these together, the US economy may not be strong in the absolute sense. However, its setup has allowed it to absorb the shock of the spike in oil prices when the conflict erupted.
What would need to happen for a
repeat of 2022, or the 1970s?
I hope that by now you can see why the US economy, or the global one for that matter, haven’t collapsed.
This doesn’t mean that the global economy or the US economy is fine. They’re merely holding up because they have absorbed the shocks so far.
By the time you read this article, the US Federal Reserve has announced a 0.25% rate hike. This may put the US economy in a more precarious position.
This raises an important question: how much more can the US economy bear from here?
The data suggest that the economy can withstand further shocks, as inflation is still significantly below 2022 levels. However, evaluating by data has its limits given it is retrospective.
Going back to the start of the article, I want to address whether we’re about to see a 1970s-style global economic situation. The situation that’s unfolding in the Middle East may suggest this is possible, but we’re not there yet.
Should the oil supply from the Middle East remain subdued, prices could remain well above US$100 a barrel. Countries may see their reserves dwindle, causing them to buy oil, which will push prices higher. This could lead to accelerating inflation that strains businesses further. That may force the Federal Reserve and other central banks to raise interest rates, with distressed companies defaulting and triggering a domino effect.
The order in which these unfold can vary, but I would watch for them as warning signs that the situation is unravelling.
Putting your money to the test
Despite my brief outline about what could happen to cause a market crisis, I want to remind you that it is merely indicative, rather than a prediction. Investors who extrapolate these trends and take short-term positions on macroeconomic and geopolitical themes have enjoyed mixed outcomes. We’ve seen that happen in the past few months.
For example, those who wagered on oil rising enjoyed some good gains from March to May. But this didn’t extend to oil stocks or gold. Those investing in the former enjoyed lower returns than if they bought oil futures, while the latter would have delivered losses for much of the last six months.
Taking positions during a military conflict is a punt at best. The well-established theories on what rises and falls can go out the window and humble even the veterans who have invested for decades.
One can rightly point out that investing in the economic impact of a conflict yields better results. That is, focusing on how it’ll affect monetary and fiscal policies, productivity, and industrial output. However, we’ve seen how differently it’s playing out this time.
Markets reward investors who understand changing relationships rather than fixed rules. It comes from understanding the dynamics in this conflict, rather than jumping to conclusions or giving up easily when the trends move against you.
Leading up to the gold and silver flash crash, my newsletter members and I had secured some profits in our gold stock holdings. As the conflict erupted, some of our gold stocks made new highs, allowing us to take further profits. During the slump in the gold and precious metals space, we identified overvalued stocks we sold and added to undervalued ones.
What metric did we use to determine which gold stocks were over- or undervalued? It wasn’t the price of gold, but the gold-oil ratio. Gold is only half the equation in determining the revenue earned by a gold producer. Profitability accounts for expenses too, which the oil price is a main driver through fuel costs, wages, and the general price level in the economy.
Having gone through three gold price cycles in the last 13 years and studied the precious metals market dynamics, I found this to be a better driver of how these companies would perform.
If you want to learn more about this, you can by checking out this presentation. I’ll show you how to understand the precious metals market, the types of assets available, and get you started on building a precious metals portfolio.
I hope you enjoyed this article. Stay tuned for my next update and have a good weekend ahead!
God Bless,

Brian Chu,
Gold Stock Pro and The Australian Gold Report




Comments