
With Woody over at the head office in the US this week, you’re stuck with me (Greg) again for this Friday’s Insider…
Apologies in advance…
I do have some good news, though. Evidence is starting to increase that inflationary pressures have peaked. I know I’ve been banging on about this for a while now, but it’s important.
That’s because peak inflation is a necessary precondition to this bear market ending.
From here, the biggest question is just how quickly inflation falls back to a level that is acceptable for central bankers to take their foot off the monetary brake.
I have no idea of the answer to that question. But I do know that energy features prominently in the answer to that.
And on that front, the signs are promising.
Oil prices are beginning to correct sharply lower. West Texas Intermediate has declined nearly 20% from its 14 June peak. Brent crude is down around 15%.
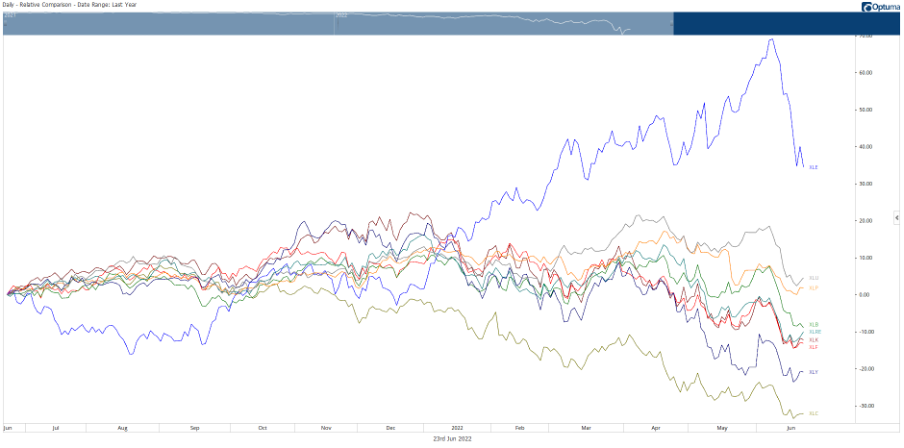
The bear market is also coming for the energy stocks. Throughout 2022, energy stocks have been clear outperformers. The chart below shows the S&P500 sub-indices.
Energy is the blue line. While every other S&P500 sector succumbed to the bear market this year, energy stocks marched higher.
|
|
| Source: Optuma |
But over the past month, energy has been the worst performer, as the chart below shows…
|
|
| Source: Optuma |
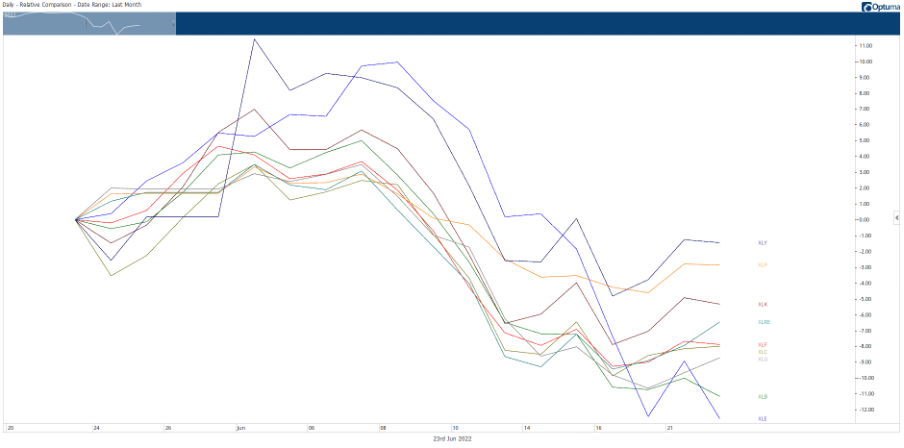
That tells me something is happening to oil on the demand/supply front.
Is demand starting to fall now, or do traders see it on the horizon as the Fed pushes the US economy into recession?
Or is it the supply situation changing?
The price spike around the time of the Russian invasion of Ukraine reflected concerns about Russian supply. But it’s becoming increasingly accepted that Russian crude is finding its way into the global market, often via Indian and Chinese refineries.
So you could be looking at a combination of weaker demand and better than expected supply.
I don’t know the actual reason. I just know that oil prices, and energy company share prices, are down sharply in recent weeks. That’s enough to make you ask, ‘what is going on exactly’?
While central bankers probably don’t know the actual reason behind the recent oil price correction, it’s exactly what they want to see.
Oil prices back below US$100 a barrel, and preferably into the US$80 a barrel range, would represent a huge step in the inflation-fighting game central bankers are playing.
It’s not just oil prices either. Coal companies have seen their share prices fall sharply in recent weeks. The Queensland government’s attempt to extract more from the coal gravy train didn’t help, but the correction began before the increase in royalties was announced.
And while we’re talking about energy, the rest of the commodities complex has also rolled over.
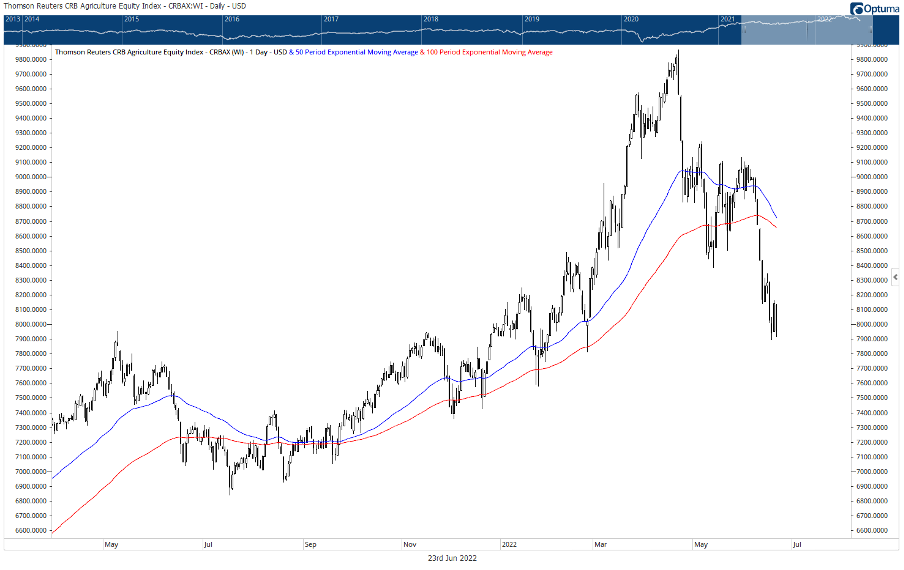
The following chart shows the Thompson Reuters CRB Agricultural Equity Index. It peaked on 21 April. Based on last week’s low, it had lost 20% from the peak. The war premium is quickly evaporating from agricultural stocks. What are they seeing ahead?
|
|
| Source: Optuma |
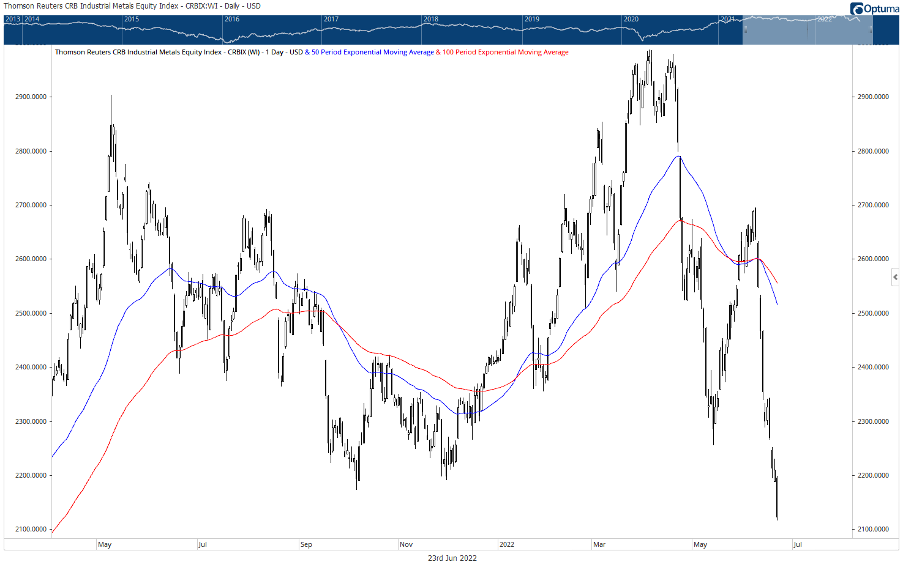
The next chart shows the Thompson Reuters CRB Industrial Metals Equity Index. It’s declined nearly 30% from its 5 April peak. Industrial metal producing stocks are now (on average) back to where they were in February 2021.
|
|
| Source: Optuma |
Putting it all together (agriculture, industrial metals, energy, precious metals stocks, etc.) gives us the broader Thomson Reuters CRB Commodities Equity Index. Remember, this is not an index of commodity prices. Rather, it is an index of listed stocks involved in the production, refining and distribution of commodities.
Since peaking on 18 April, this index is down around 20% too.
|
|
| Source: Optuma |
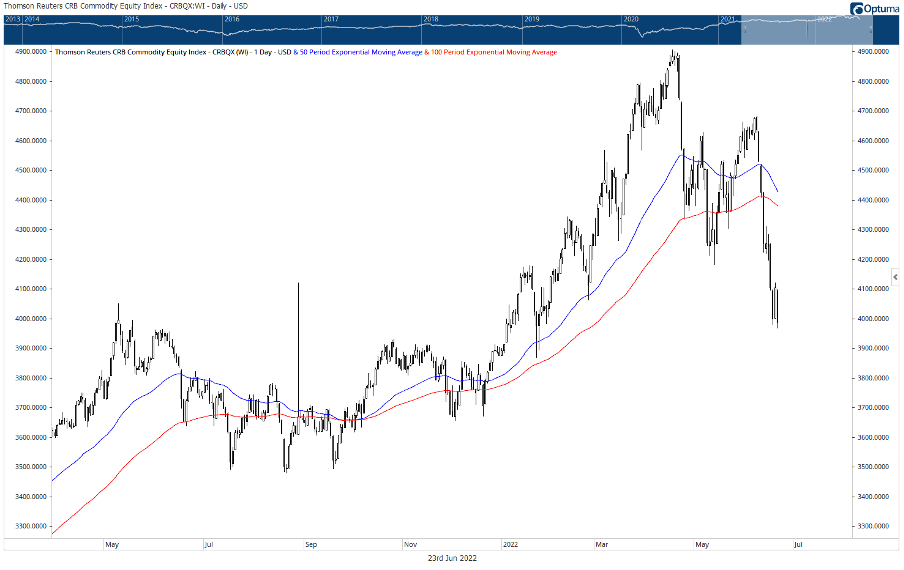
For comparison, the broader commodities price index peaked on 9 June, so you could say that equity prices lead the moves in the underlying commodity.
To me, this is all just further evidence that inflation has peaked.
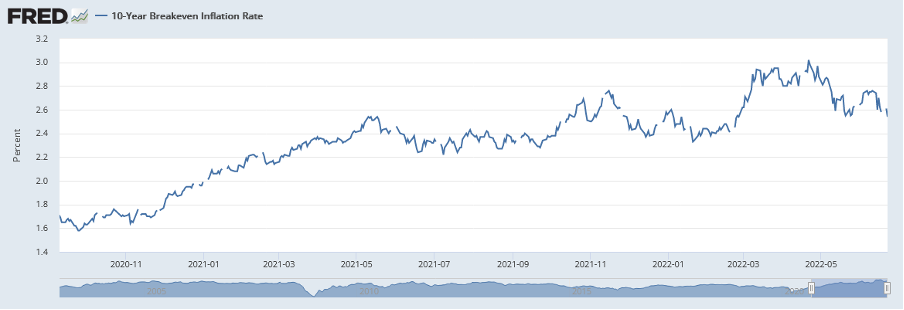
Do you remember in Monday’s Insider I mentioned how the US 10-year inflation breakeven rate peaked on 21 April? That was the peak for agricultural stocks. Industrial commodities stocks and commodity producers in general also made highs in April.
As you can see below, the US 10-year inflation breakeven rate is now falling. It’s an implied measure of average inflation over the next 10 years. Since its April high at 3.02%, it’s fallen to 2.54%. In other words, it’s moving in the right direction for the Fed.
|
|
| Source: Fred |
The question from here — and it’s an important one for stock market investors — is just how quickly the rate of inflation comes down.
Because central banks won’t just be content with knowing inflation has peaked. They want it back in the box. Back in the box is somewhere around 2%, which is a long way from where it is now.
Of course, a recession will help. That’s what falling commodity prices are signaling. (Copper plunged 5% overnight.)
A recession/slowdown will also hurt company earnings. But investors have yet to experience much pain on this front.
With this in mind, a colleague sent me this clip from the Financial Review yesterday:
‘Moreover, ASX earnings forecasts are ripe for surprises. Morgan Stanley’s local equity strategist Chris Nicol points out that about 120 companies in the ASX 200 have not had their earnings forecasts updated since the February reporting season, and about 43 per cent of ASX 200 firms have earnings estimates that are more than 80 days old.
‘To put it mildly, a fair bit has happened in the global and local economy since early April (that’s 80 days ago).
‘So we are likely to see both analysts re-examining their EPS numbers and more companies confessing to weaker results.
‘The US quarterly earnings season, which starts next week in earnest, could provide another catalyst for downgrades.’
That’s right. A lot has happened since early April. Inflation has peaked, and we’re now moving back into a disinflationary environment as higher real interest rates start to bite. Company earnings announcements in the next few months will no doubt reflect that reality.
Yes, it’s going to take some time for central banks to get inflation under control. But, as always, the stock market will price it in well before it shows up in the numbers.
Which is why you need to look at other indicators like oil prices, earnings downgrades, the stocks price reaction to news (rather than the news itself) and bond yields.
In other words, the market will bottom well before headline inflation numbers give you the all clear. So focusing on inflation is a rear-view mirror game.
The good news for you as an investor is that inflation has peaked. That tells you that this bear market might not be as long and drawn out as many expect.
Regards,
 |
Greg Canavan,
Editor, The Insider
