‘You ain’t seen nothin’ yet
‘B-b-b-baby, you just ain’t seen n-n-n-nothin’ yet
‘Here’s something that you’re never gonna forget
‘B-b-b-baby, you just ain’t seen n-n-n-nothin’ yet
‘Nothin’ yet, you ain’t been around’
Bachman-Turner Overdrive
Any teenager of the ‘70s will instantly recognise these lyrics from Bachman-Turner Overdrive (BTO).
The single released in 1974 was a global hit…we (even those of us with vocal cords closely resembling the sound of a strangled cat) stuttered along to:
‘B-b-b-baby, you ain’t seen nothin’ yet.’
But, back then, who really knew the meaning of these lyrics?
‘I met a devil woman
‘She took my heart away
‘She said, I’ve had it comin’ to me
‘But I wanted it that way
‘I think that any love is good lovin’
‘So I took what I could get, mmh’
He’d met an alluring temptress — a ‘devil woman’ — who was going to break his heart and crush him emotionally…he knew it.
And she warned of what was to come, telling him, he…‘ain’t seen nothin’ yet’.
In the financial world, there are many temptations…teasing and tantalising us. The attraction of having something ‘too good to be true’, can be difficult to resist. The prospect, the passion, the profit…oh, how it can make the heart swoon.
Have you ever really, truly, and deeply loved and lost in the market?
The financial world’s ‘devil woman’ has been seducing investors since Tulip Mania. And, while we all know how each and every steamy and torrid affair ends, we kid ourselves into believing…this time will be different.
But, to those who have never really, truly, and deeply loved and lost in the market, warnings of ‘you ain’t seen nothin’ yet’ have no real emotional meaning.
Fellow editor, Jim Rickards, has seen the market’s ‘devil woman’ in many guises during his long and storied career.
Jim recently warned:
‘No need for hypotheticals this year, we’ve got a real financial war going on…
‘Markets are affected by what has happened before’.
Jim’s service, Jim Rickards’ Strategic Intelligence Australia, is a must-read for those wanting to stay out of the clutches of a temptress who is hell-bent on leaving a trail of misery and heartbreak.
Please go here to find out more about Jim Rickards’ Strategic Intelligence Australia.
As Jim pointed out, ‘markets are affected by what has happened before.’
As you’d expect…rhythmic patterns repeat
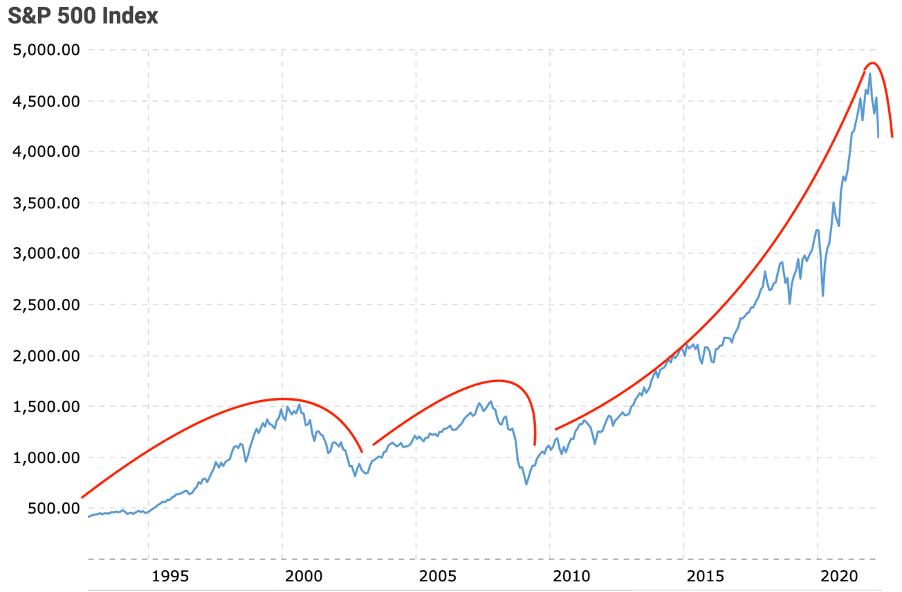
This chart — from a recent edition of The Gowdie Letter — illustrates how the wave-like pattern of the S&P 500 is as rhythmic as the ones rolling in on our shores every day.
The volume and height of each wave vary, but the pattern remains the same…build, rise, crest, and crash…much like those torrid and ill-fated love affairs you hear about:
|
|
|
Source: Macrotrends |
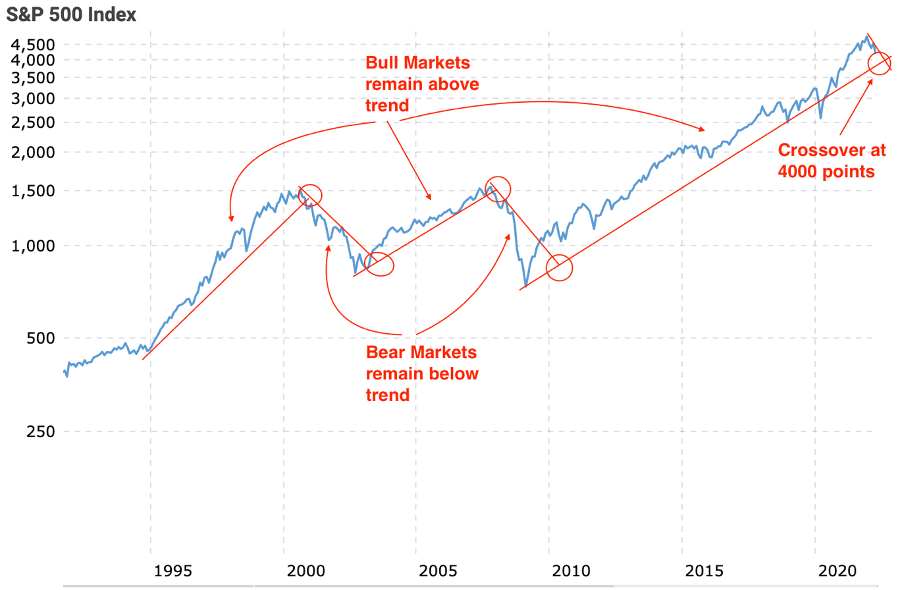
The other pattern that remains constant is how the index remains ABOVE trend in a BULL market (due to buying pressure) and BELOW trend in a BEAR market (due to selling pressure):
|
|
|
Source: Macrotrends |
The S&P 500 Index is on the cusp of surrendering to the inevitable heartbreak that follows all market booms.
Those wanting to rekindle the passion — the buy the dippers — will fight to keep the relationship from crashing on the rocks…history tells us their efforts aren’t going to change the destiny of this market.
And that destiny is…
MINUS 5% PER ANNUM for the NEXT DECADE
Thanks to the heartbreaks experienced by generations of investors who came before us, we are much better informed on the passions, perils, and pain of market lust.
Sadly, the lessons go largely unheeded. We seem destined to repeat the errors of our forefathers.
In an effort to warn of the pain that’s in our future, the 14 March 2022 issue of The Gowdie Letter looked at the price to be paid for the Fed’s reckless actions of the past decade:
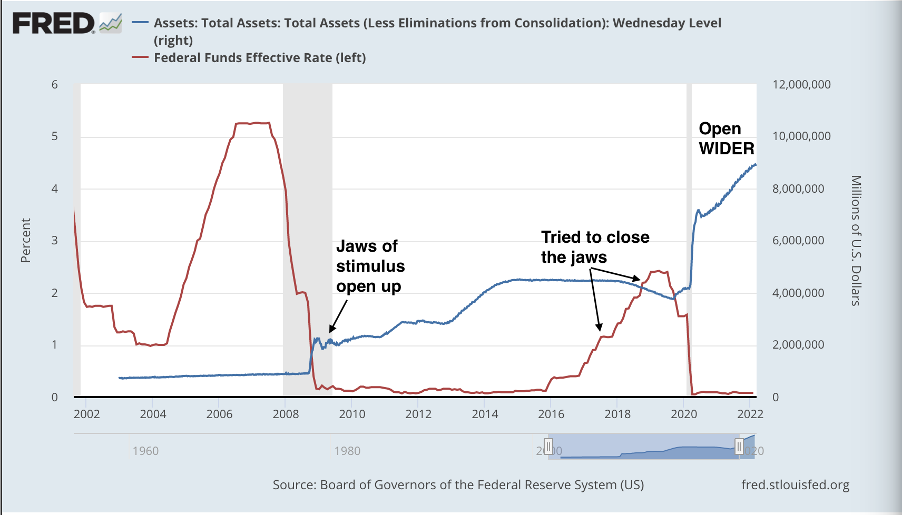
‘Ever since the Fed applied the “jaws of life” to Wall Street in 2008, we’ve been living on borrowed time.
|
|
|
Source: Federal Reserve Economic Data |
‘The combination of lower rates (red line to left-hand scale) and Fed liquidity (blue line to right-hand scale) stabilised and then revived market fortunes.
‘Between 2016 and 2018, the Fed tried to normalise rates and ease up on liquidity. But it proved to be short-lived.
‘At the first sign of market trouble in 2020, the Pavlovian Fed were panicked into opening “the jaws” wider…much wider.
‘Sparking a speculative frenzy that’s taken a variety of asset classes (shares, property, bonds, cryptos) to dizzying heights.
‘Previous records of society’s collective irrationality (1929, Dotcom, Subprime) have easily been eclipsed by the “Everything Bubble”.
‘Ephesians 3:18 makes mention of …“breadth and length and height and depth”…on every single one of these measurements, the scale of this Bubble is in a league all of its own…heading for an ending of equally Biblical proportions.
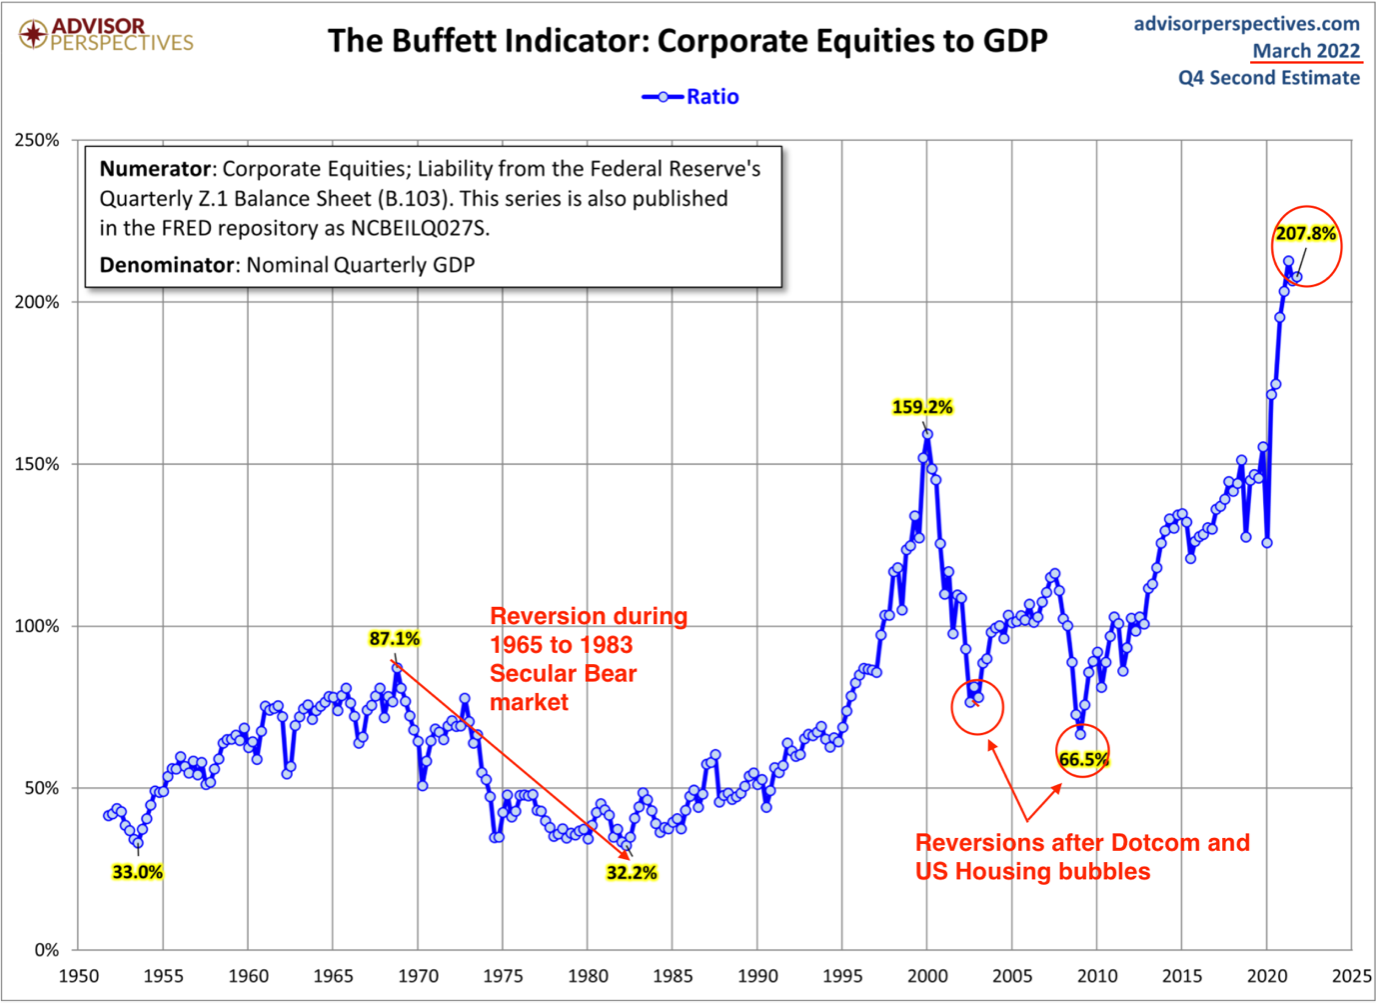
‘The Buffett Indicator (named after Warren Buffett said, “[it’s] probably the best single measure of where valuations stand at any given moment”) shows, even after the recent downside action, just how elevated the US market valuation…stands at this given moment:
|
|
|
Source: Advisor Perspective |
‘Previous “peak to trough” reversions have been influenced by different factors and occurred over differing time frames…but they ALL have one thing in common…they did REVERT!
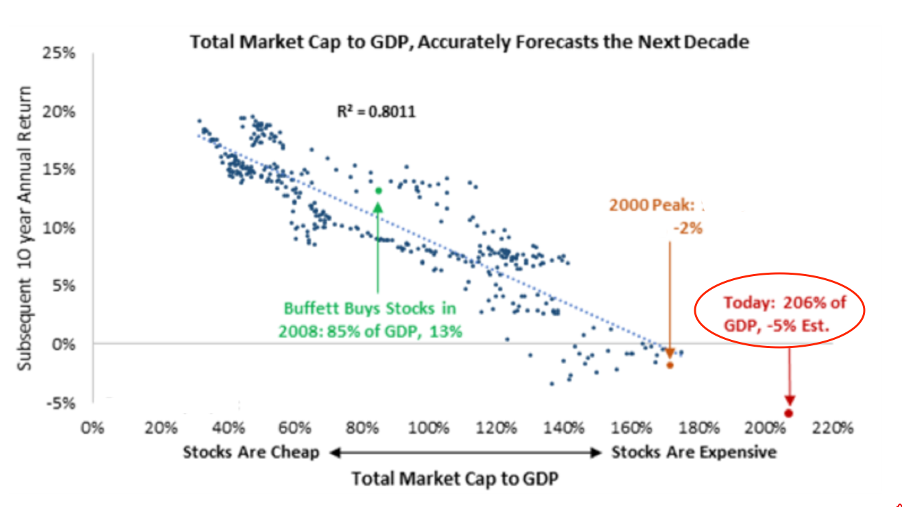
‘This scatter chart takes the valuation data from the Buffett Indicator (horizontal scale) and plots it against the subsequent 10-year Annual Return (vertical scale) from the US share market:
|
|
|
Source: KCR |
‘The trend is evident.
‘The cheaper the market cap-to-GDP, the higher the subsequent return.
‘And the reverse holds true…the more expensive, the lower the future returns.
‘Buffett is well aware of the relationship between value and future returns.
‘As reported in Berkshire Hathaway’s latest Letter to Shareholders Report:
“Berkshire’s balance sheet includes $144 billion of cash and cash equivalents…Of this sum, $120 billion is held in U.S. Treasury bills, all maturing in less than a year.”
‘In his letter, Buffett explains why his company is sitting on so much cash:
“…we find little that excites us…Long-term interest rates that are low push the prices of all productive investments upward, whether these are stocks, apartments, farms, oil wells, whatever.”
‘When the valuation versus return data indicates the US market is poised to deliver a MINUS 5% PER ANNUM return over the next decade, you can understand why Buffett sees cash as the least worst option.
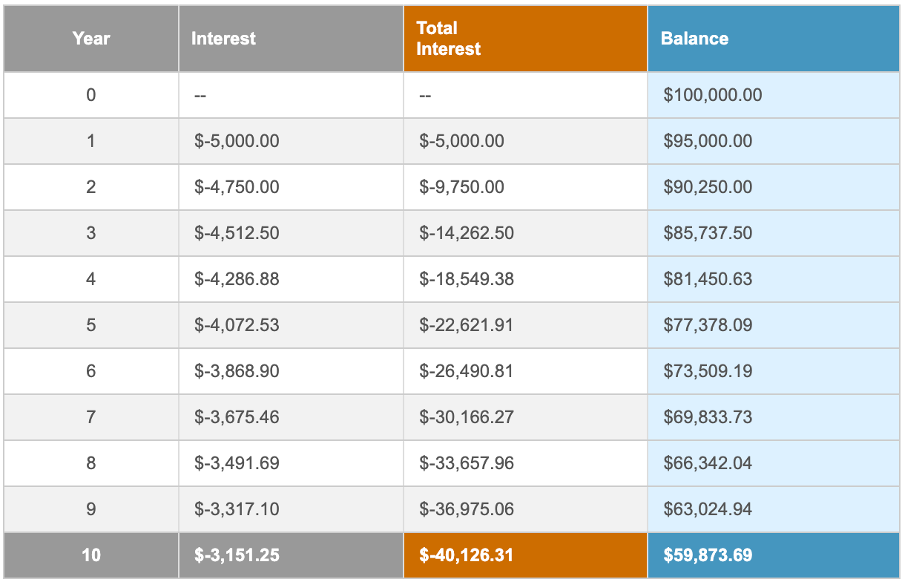
‘In dollar terms, this is what MINUS 5% PER ANNUM, over a 10-year period, equates to on a $100k investment:
|
|
|
Source: The Calculator Site |
‘If Buffett deployed US$100 billion of his cash holding into the market today, there’s a good chance it’ll only be worth US$60 billion in 2032…Buffett didn’t get to where he is today by making these sorts of amateurish mistakes.
‘Minus 5% per annum for a decade…that’s the payment coming due from the Fed’s liberal application of the “jaws of life”.’
The ‘devil woman’ has told us countless times…‘you ain’t seen nothin’ yet’.
But, this time, I think that warning carries even more meaning…the ‘Everything Bubble’ is the greatest multi-asset bubble in history.
When investors fall out of love with stocks, bonds, property, cryptos, and private equity…we are in for a period of emotional upheaval…one we ain’t never seen before.
Regards,
 |
Vern Gowdie,
Editor, The Daily Reckoning Australia
