
I don’t know what Albert might’ve made of what you’re about to read. But relativity is important in the bond market too. It tells you a lot about what’s going on. And, right now, the bond market’s theory of relativity is telling you to worry.
First, let’s review the basics of bonds…
A bond’s yield is the annual return you get from holding it to maturity — when the loan is paid back. Because the future cash flow returns of a bond are fixed, when the price goes down, the yield goes up.
That shouldn’t be as confusing as it sounds. It’s the same for a dividend stock. The cheaper the share price, the higher the dividend yield — if nothing else changes…
What makes bonds interesting isn’t so much their yields though. The yield alone doesn’t tell you what you need to know. Let’s explore why, in case you’re not a physicist familiar with relativity.
If I tell you that a bond has a yield of 5%, that doesn’t tell you anything you want to know as an investor. Because everything in the bond market is relative.
5% in the ‘70s was low. Today, it’s high. Inflation has shifted the meaning of 5%. But inflation is not the only way in which things are relative in the bond market.
5% for Aussie government bonds is high. For Argentinian bonds, it isn’t. The risk profile is different.
You need to think comparatively
My point is that to understand what’s going on in the bond market, you need to think comparatively at all times. ‘Relative to what…?’
Historically, the comparative rate you should be comparing to most of the time is the US Treasury bond rate. It’s considered risk-free (by academics who come up with equations for bond prices) and so it is like the reference point of global bond markets. In physics terms, it’s the Earth or the sun. (I’m not a physicist either…)
But it depends on what you’re trying to measure, of course. For example, if you want to find the safest car company to invest in, you might compare the yields on their various bonds. Higher yields signal more risk.
Or if you want to measure risk in the banking system, you’d compare the difference in yield between the interbank lending market and Treasury bonds. If bank lending costs spike, any number of things could be going on. Inflation, interest rate hikes, and more. But if they spike relative to Treasury yields, that suggests a crisis of confidence between banks specifically.
The risk of a financial crisis in Asia can be measured by the difference in yield between Asian bonds and US ones.
And so on and so forth. We’ll get to some of these measures as they stand in the real world in a moment. First, one more bit of terminology.
The difference in yield between two assets is referred to as the spread by analysts. That’s what they like to chart over time — how much higher one yield is than another.
Why? What does this information tell you?
Well, when you (used to) watch Formula 1 racing, did they tell you the lap times of each driver? Or did they tell you how far behind the race leader each driver is?
Speed in a race is relative too, right? The lap time of each driver individually doesn’t tell you what matters — who’s winning and by how much. The spread between them does.
In the same way, the bond spread should tell you how stressed the riskier bond is by telling you the size of the gap between bond yields. And if the spread is rising — widening — then the amount of risk is rising.
For example, when everyone believes the Germans will bail out the Greeks, then the spread between Greek and German bonds should be low. When people get worried about Greece, not only will the bond yield go up, but, perhaps more importantly according to the theory of bond market relativity, the spread will widen. This could happen while both yields are rising or falling — it’s only the relative amount, measured by the spread — that really matters.
It’s possible for both the Greek and German bonds to move up or down at the same pace, of course. In which case the spread stays stable. It’s like when rain hits the racetrack, everyone slows down. The key measure — the gap to the leader — stays stable though. Making it the better measure.
All this is playing out in European bonds again right now. Bond spreads there have been rising since the coronavirus outbreak. People are worried about Italy especially, so the spread over German bonds is growing. But the same goes for Spain, Portugal, Ireland, and France.
|
|
| Source: Zerohedge |

Spreads are widening all over the place
But it’s not just Europe that’s signalling trouble. The Market Ear blog is keeping its readers up to date on what other spreads are blowing out. Some of them seem obscure. If you get confused about some of my examples, I’m sure you’ll get the overall message — spreads are widening all over the place.
I’ll explain what that means shortly, but let’s look at some data first.
The spread on high-risk bonds issued by Asian companies, but denominated in US dollars, are surging. That’s because of carnage in the currency market. The US dollar is rising, making it harder for foreign companies to repay their debts.
|
|
| Source: The Market Ear |
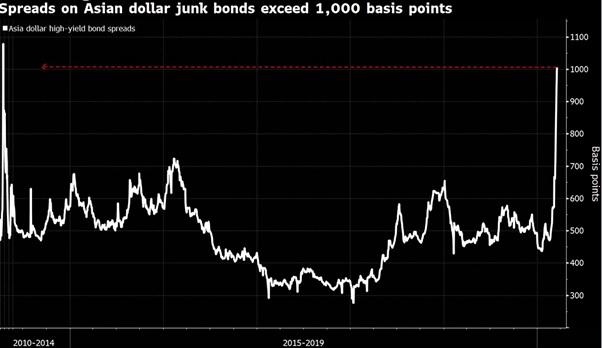
The message is that Asian firms will struggle to repay their debts. That’s what this spread is telling you.
Not that US firms are sitting pretty. The spreads on their loans are surging too. Again, this shows that US firms will struggle to repay their debts.
|
|
| Source: The Market Ear |
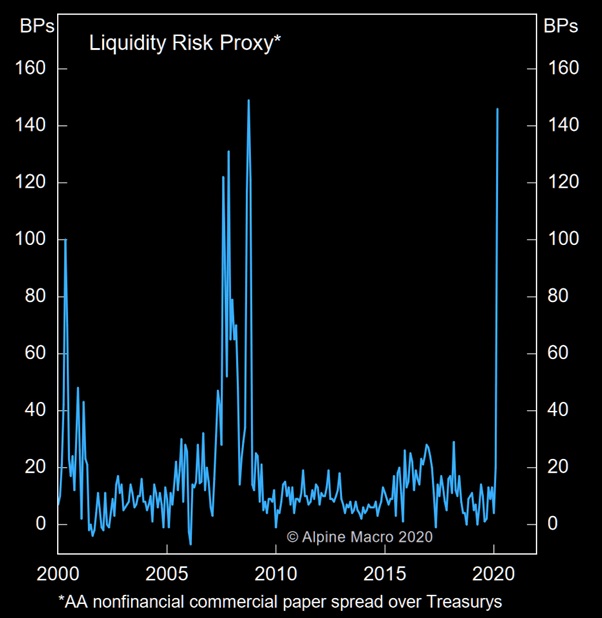
Banks are in trouble
The banks are in trouble too, but not compared to 2008. The spread on interbank borrowing is rising, but not spiking out of control in the same way.
|
|
| Source: The Market Ear |
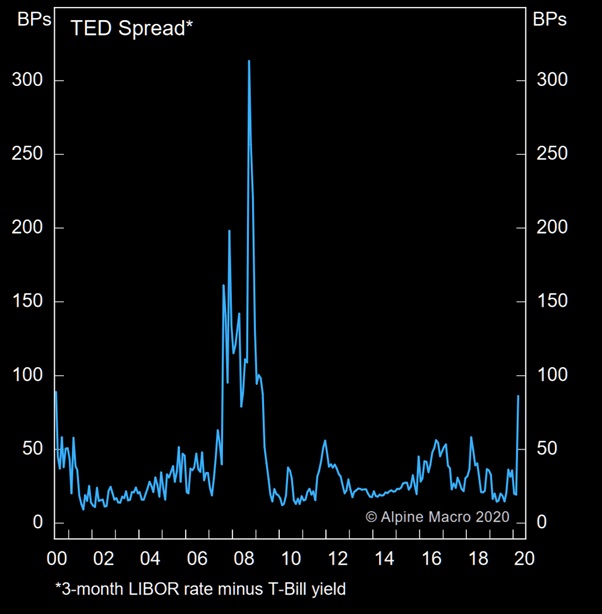
That makes sense because the economic shock of COVID-19 is hitting ordinary firms in the real economy more than banks, for now.
One of my own predictions is that this will reverse because banks are inherently more fragile businesses. The rising spreads on other firms’ bonds suggest that bank loans will take a hit eventually too, and thereby banks themselves.
Now, if you ask me, instead of rescuing the banking sector while the real economy implodes, it should be the other way around. But bankers loan money to governments and so they get a central bank to rescue them both.
I’m yet to see proposals for a Central Petrol Station or Reserve Airline of Australia whose job it is to keep their industries afloat during a crisis by printing money for them. But let’s not give anyone any ideas.
So, for now, spreads across debt markets are widening. Risks are being priced into bond markets. And in bond markets, risks mean defaults. Something we haven’t seen yet. Something yet to hit stock markets with the consequences.
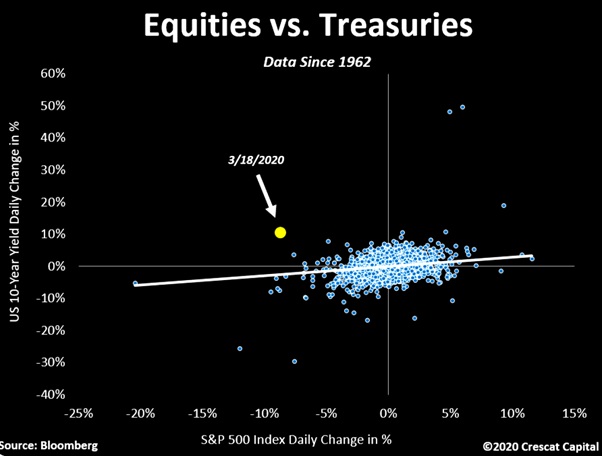
What makes all this deeply worrying is what the spreads don’t show you. German and US bonds are falling in price too — their yields are rising. This is hidden in the spreads charts because they are the base of the spread. The race leader and the pack are both going faster.
I’ll try a more concerning metaphor. While the buildings people are in are collapsing, there’s also an earthquake underway if they make it out of the building.
This chart, also from The Market Ear blog, shows just how rare and unusual this drop in ‘safe’ bonds is. US bond prices are falling at the same time as stocks, to an extent never seen before.
|
|
| Source: The Market Ear |
There are some lovely soothing headlines about this phenomenon in the mainstream media. ‘Nowhere to hide’ and ‘diversification not working’ are the common themes. Those who invested in bonds, expecting them to perform well as the stock market crashes, have found otherwise.
This holds in Aussie government bonds too. They’ve dropped, and fast, from impressive heights.
In coming weeks, you’ll be hearing all about bond spreads again, just like in 2011 when the European sovereign debt mess was at its worst.
But don’t forget where all of this leads us in the end. Somewhere far more important than bonds, stocks, or defaults.
| Until next time, |
 |
| Nick Hubble, |

Comments