Dear Reader,
‘How much do you need to retire?’
That’s not a question.
It’s the title of an article recently published by a major bank.
It was too tempting to resist.
I took the hook.
What’s the industry’s take on ‘how much is enough?’.
Determining the amount of capital needed is a fairly straightforward mathematical exercise.
The factors are…
What’s the income required?
What’s the assumed REAL (after inflation) earnings rate?
If someone wants $50k per annum (indexed) and assumes they can earn a 10% REAL return, then the amount required is $500k.
If you think longevity is in your genes, you might want to add a buffer of say 10% to your ‘number’.
Simple…if your assumptions are correct.
But…
What if…the inputs are wrong?
What if…you need more income, or the return is less?
The ‘How much do you need to retire?’ article asked clients…
‘What return on investment on your capital can you expect?’
The consensus was:
‘The current number is anywhere from 3% to 10% pa less inflation with most retires are assuming they could and should be able to earn 5% pa after inflation.’
The ‘could and should’ part took me a little by surprise.
This is what happens after a sustained period of unrealistic markets, they set up unrealistic expectations.
Earn 5% per annum after inflation…good luck.
Where do you find an investment — especially in this environment — that can deliver a 5% AFTER INFLATION return consistently WITHOUT exposing your capital to serious downside risk?
The failure of the canvassed retirees to ask ‘what if’ questions means they are in for a very rude shock.
Assume…an ASS of U and ME
The problem with forecasting is you are compelled to make assumptions.
And our assumptions are inherently based on recent experiences.
What if the past is not our future?
In July 2005, Ben Bernanke (former US Federal Reserve chairman) was asked in a CNBC interview (emphasis added):
‘What is the worst-case scenario if in fact we were to see [housing] prices come down substantially across the country?’
Bernanke’s reply was (emphasis added):
‘Well, I guess I don’t buy your premise. It’s a pretty unlikely possibility. We’ve never had a decline in house prices on a nationwide basis. So, what I think what is more likely is that house prices will slow, maybe stabilize, might slow consumption spending a bit. I don’t think it’s gonna drive the economy too far from its full employment path, though.’
With hindsight we know Bernanke made an ASS of himself…and, also of all the people who bought his fatally flawed theory.
Bernanke was wrong, wrong, and wrong.
He could have saved himself a lot of embarrassment if only he’d taken heed of Hyman Minsky’s hypothesis — ‘stability creates instability’.
The longer the period of price stability, the greater the likelihood we think this pattern will continue.
Safe in the belief US property values never go down, investors discounted risk out of the investment equation.
With a ‘guaranteed’ road to riches — because house prices only ever go up or, at worse, stabilise — the thinking becomes: ‘Why wouldn’t you borrow as much as you can, with the least deposit, for as many houses as possible?’.
A prolonged period of price increases lulls people into a false sense of security.
Flashing dollar signs blind them to the risks in their financial overreach.
Based on the physics of ‘for every action there is an equal and opposite reaction’, history shows us ‘the longer the period of stability, the greater the eventual instability’.
Over the past few years there’ve been several ‘what if’ questions I’ve been grappling with.
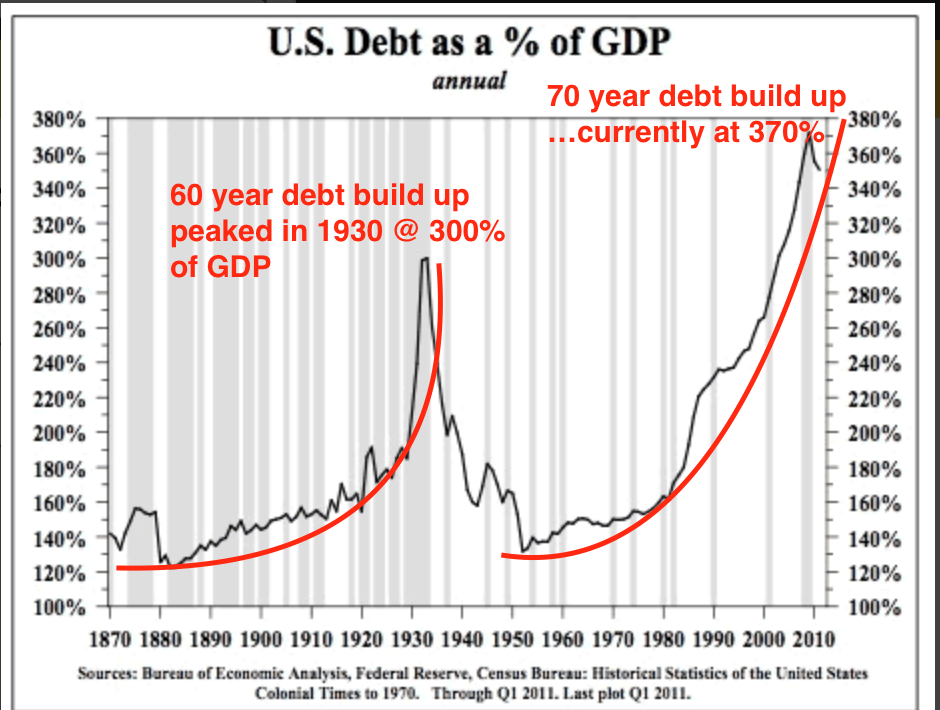
What if the past 60 or so years of economic growth and financial prosperity was not normal?
The last Great Depression was 90 years ago — the further we go away from the last one, the closer we are to the next one.
What was the cause of the Great Depression?
A debt buildup that began in 1870 and ended spectacularly in the 1930s.
Decades of stability created instability.
|
|
|
Source: Seeking Alpha |
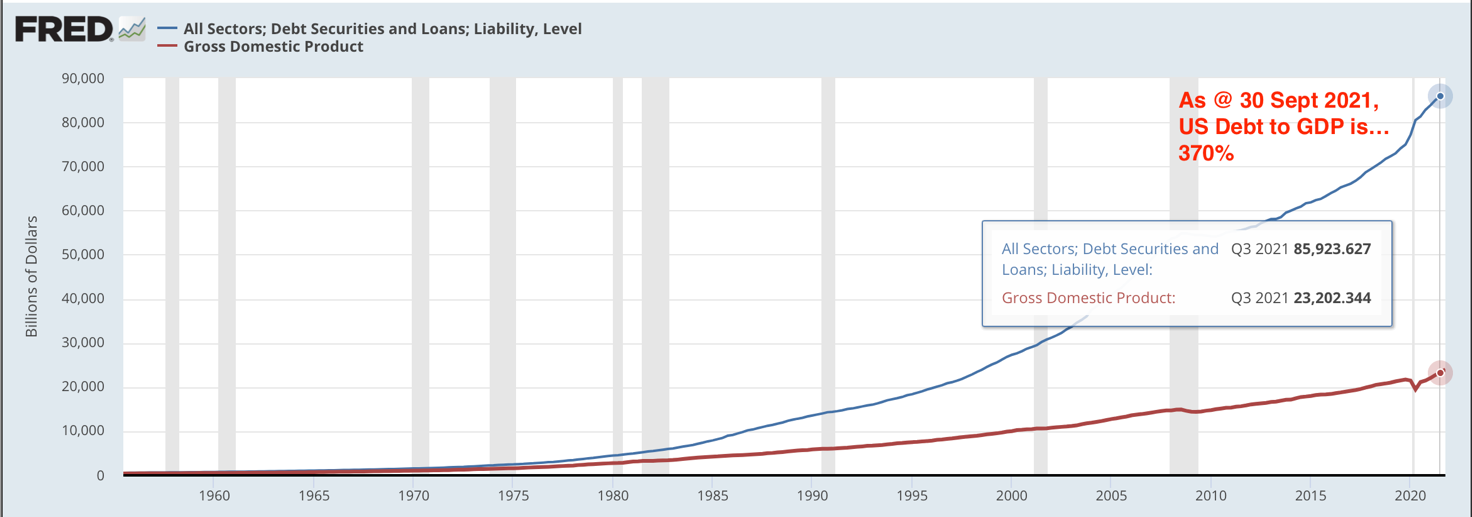
And here we go again…seven decades of stability has pushed the current US debt as a percentage of GDP well beyond the 1929 peak:
|
|
|
Source: Federal Reserve Economic Data |
What happened after the Great Depression was unlike anything anybody had experienced in their lifetimes.
If you’d asked retirees in 1928 or early 1929: ‘What return on investment on your capital can you expect?’, my guess is, based on the booming Roaring Twenties market, they too would have said ‘We could and should be able to earn’…
People expected the 1930s to be a repeat of the 1920s…weren’t they in for a shock!
As we know from history, what has been is not necessarily what will be.
Excesses need to be corrected.
Get real about the REAL return
The market conditions of recent times ARE NOT REAL.
They have been artificially created by the US Federal Reserve Bank’s misguided belief in the share market being a barometer for economic strength.
Excess ALWAYS get corrected…even the ones created by the almighty Fed.
Those aligned with the ‘could and should’ thinking should seriously consider these ‘what if’ questions…
What if…the Fed can’t save the day?
What if…investors no longer buy what the Fed is selling?
What if…the market does correct, how much could that be?
On that last question, this is an edited extract from the February 2022 issue of The Gowdie Letter:
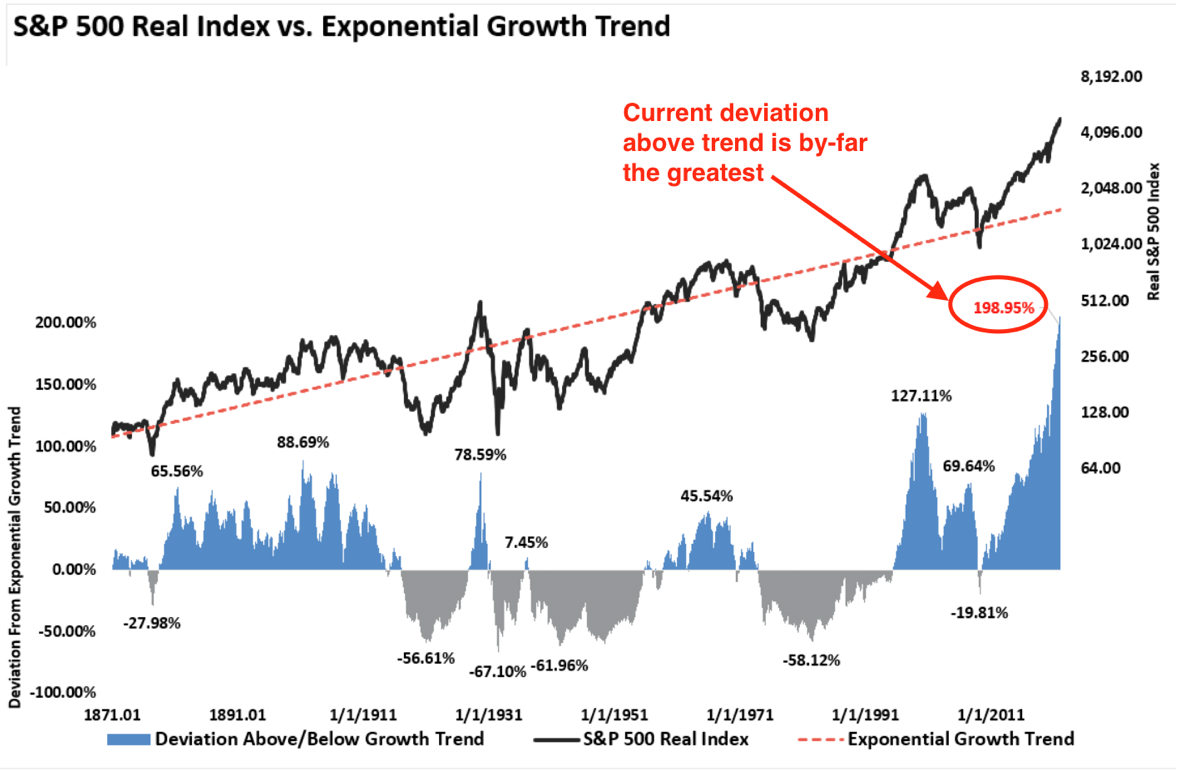
‘…here’s one final long-term valuation chart — going back to 1871.
‘Over the very long term — 150 years — the S&P 500 Index has established an exponential REAL (after-inflation) growth trend.
‘In percentage terms, the REAL (after-inflation) growth rate of the S&P 500 Index is slightly under 2% per annum.
‘The market’s long-term growth, when drawn with a trend line (red dotted line), is a nice, neat lineal progression.
‘But markets being markets, nothing is ever nice and neat or lineal.
‘Markets move cyclically, with steps (and at times, leaps) in a forward and backward motion.
‘There are periods in the cycle when the S&P 500 is above and below the lineal growth trend.
‘The degree of trend deviation is shown in the blue (above) and grey (below) shaded areas at the bottom.
‘All previous deviations above AND below the trend line, in due course, reverted to trend.
‘The current deviation above the trend — at 198.95% — is THE MOST EXTREME in US market history.
‘Returning to trend requires a correction of at least 61%.’
|
|
|
Source: RIA |
The market could give two hoots about what you ‘could and should’ expect.
It’s going to do what it’s going to do…good or bad, up or down.
Here’s a series of ‘what if’ scenarios to consider…
What if you want $50k per annum on an expected REAL return of 5%? You need $1 million.
What if you invest $1 million in growth assets (cause that’s the only portfolio with a snowball in hell’s chance of making 5% real return) and it falls (say) 50% in value?
What if you panic and sell out and invest in the safety of cash?
Now you have $500k earning 0.1%…giving you a $500 per annum income.
The retirement article tells me there are very few people who are expecting the unexpected.
Having been through these market cycles before, I am certain of only one thing…people are in for a very rude shock.
Regards,
 |
Vern Gowdie,
Editor,The Daily Reckoning Australia


