
Nature is the best classroom in the world.
Did you know it was the movement of whales that led to the development of the submarine?
Or that Swiss engineer, George de Mestral, after noticing the burrs of burdock stuck to his dog’s coat, invented velcro?
Personally, I’m fascinated by the changing nature of the ocean. From rolling waves to thunderous surf. Undertows. Strong rips. Shifting sand bars.
No two days at the beach are ever the same. Conditions can look inviting, but beneath the glistening surface, there is a host of traps for young players…much like investment markets.
High tides always remind me of market peaks. No two highs are ever identical.
What if you were asked to place a stick in the sand at the point where you think the tide will peak?
Will it be the same as last month’s full Moon high tide?
Maybe. Maybe not.
There are so many variables that can conspire against your marker in the sand being in the wrong position.
The alignment of the Moon, Sun, and Earth.
Ocean currents.
Weather.
Changes in the shoreline.
There is only NON-variable in this exercise…we know with absolute certainty there will be a HIGH tide followed by a LOW tide.
That’s the ebb and flow cycle of nature.
Trying to accurately predict exactly how high or low those tides are going to be is an exercise in educated guesswork.
The metaphorical high-tide marker I placed in the sand for the current US share market is well and truly under water.
Wall Street’s high tide is the highest of the high…surging past all others.
A king tide like no other
But, just like ocean tides, there’s also a NON-variable with markets…they too peak and recede.
While your imagination is engaged, let’s look at the following chart of John Hussman’s Margin-Adjusted P/E (MAPE) in a slightly different way.
Imagine it’s a drone shot…looking straight down on the US share market shoreline.
Think of the points closest to the top line as the high tide markers for the US market since 1928.
And those closest to the date line on the bottom are the low tide markers:
|
|
| Source: Hussman Strategic Advisors |
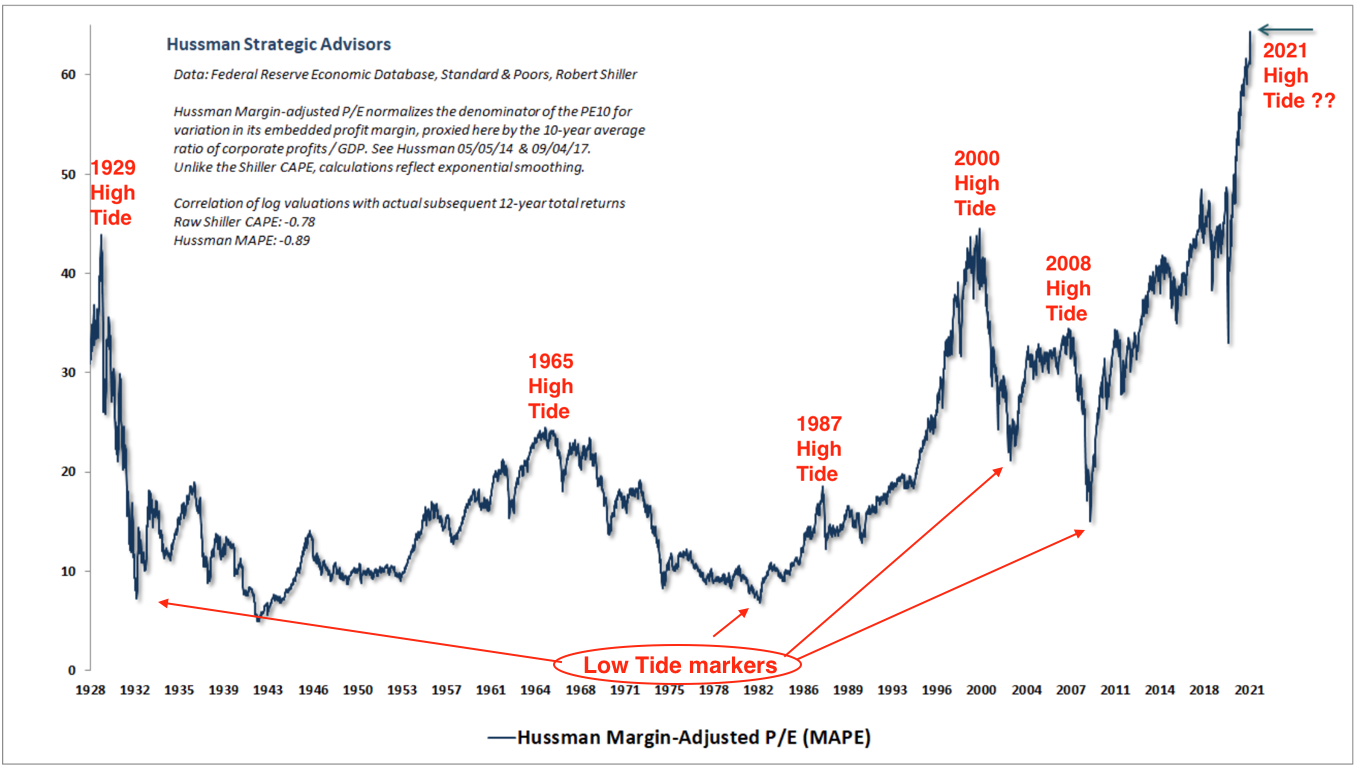
From our bird’s-eye view of the market’s historical shoreline, the market’s tidal flow is quite evident.
High tide followed by low tide.
The ‘ebb and flow’ pattern NEVER varies.
However, there’s a great deal of variance in the positioning of the markers signifying the high and low water marks.
The US market has registered three king tides…1929, 2000, and now.
And some extremely low ones…1932, early 1940s, and 1982.
Some markers are much closer in proximity than others…but not identical.
Conditions vary from peak to peak…debt levels; speculative fever; interest rates; external shocks; inflation; central bank intervention.
Sometimes, the alignment (and weightings) of these factors is greater than at other times.
However, one thing is abundantly clear from our ‘drone shot’…this high tide is a super-king…one that’s never been seen before.
According to John Hussman:
‘Our Margin-Adjusted P/E (MAPE) is nearly as reliable as MarketCap/GVA [in predicting 12-year future returns] and spans a much longer history to the early-1900’s. Notably, this measure has moved to extremes that eclipse both peaks observed in 1929 and 2000.’
In valuation terms, the current tidal peak exceeds the market’s previous (and infamous) ones of 1929 and 2000.
Will it surge even higher?
Maybe.
But you must ask: How much higher can it go before the world spins on its axis and the receding low tide begins?
And when it does, the $64 question everyone will be trying to answer is: ‘Where would you put your marker in the sand for the low tide mark?’
Will it be a receding market outflow of 30%, 50%, 65%, or maybe (just maybe) 80%?
None of these low-tide markers are without precedent…they’ve all happened before.
Based on the principle of ‘equal and opposite forces’, if market tides can surprise on the high side, why can’t low tides deliver something equally unexpected on the downside?
Oh, that’s right, central bankers have been bestowed with powers greater than nature itself.
With their Moses-like ability, they’ll stem the receding waters…and stop the outflowing tide to go no further.
Really?
Human nature is the cycle of predictability
During the Roaring Twenties, Roger Babson was an investment banker/fund manager/statistician/economist…and a very successful investor.
He too was an avid observer of nature.
To quote from Business Insider (emphasis added):
‘Babson’s success as an investor and in running his investment research firm was, to some large degree, based on his unique (some might say unorthodox) beliefs in how markets functioned.
‘…during his time at M.I.T., Babson became interested in Newton’s third law and posited a theory that the business cycle was driven in part by the interplay between human participants and gravity.
‘Working with M.I.T. Professor of Engineering George F. Swain, Babson applied the concept of actions and reactions to classical economics, which led to the development of the Babsonchart of Economic Indicators.’
Based on his proprietary indicators, Babson warned investors at the September 1927 annual National Business Executives Conference:
‘…that the stock markets were reaching dangerous levels.’
At that time, the Dow was around 200 points…doubling in value over the three previous years.
No one listened.
A year later, the Dow was up another 30%.
At the 1928 annual National Business Executives Conference, Babson warned the market was overvalued and…
‘…a terrific correction could occur.’
No one listened.
The market surged (almost) another 50%…rising from 260 points to 380 points.
In September 1929, Babson’s address to the National Business Executives Conference in Massachusetts began with:
‘I repeat what I said at this time last year and the year before, that sooner or later a crash is coming which will take down the leading stocks…’
Eventually, logic (mathematics) trumps emotion. However, you may have to wait longer than you think for rational thought to prevail.
In Babson’s case, his conviction in the maths (and human and mother nature) was vindicated in October 1929.
The following excerpts from his 1929 address are just as true today as they were in the late 1920s.
Please read them carefully and note the strong correlation between the mindset then and now (emphasis added):
‘Fair weather cannot always continue. The Economic Cycle is in progress today as it was in the past. The Federal Reserve System has put the banks in a strong position, but it has not changed human nature.
‘More people are borrowing and speculating today than ever in our history. Sooner or later a crash is coming and it may be terrific.
‘Wise are those investors who now get out of debt and reef their sails. This does not mean selling all you have, but it does mean paying up your loans and avoiding margin speculation.
‘Sooner or later the stock market boom will collapse…Some day the time is coming when the market will begin to slide off, sellers will exceed buyers, and paper profits will begin to disappear. Then there will immediately be a stampede to save what paper profits then exist.’
Very prophetic.
When the tide of investor sentiment turns from very high to very low, the strong market undertow is going to sweep the Fed’s credibility out to sea…act now to avoid your portfolio suffering the same fate.
Regards,
 |
Vern Gowdie,
Editor, The Daily Reckoning Australia
