US markets fell sharply on Friday. The Dow lost 1.6% while the S&P 500 declined 1.3%. The NASDAQ fared better, falling 0.9%.
The Wall Street Journal explains the reason for the selling:
‘Policy makers had signaled Wednesday that they expect to raise interest rates by late 2023, sooner than they had previously anticipated. Sentiment waned again on Friday after Federal Reserve Bank of St. Louis leader James Bullard said on CNBC that he expects the first rate increase even sooner, in late 2022.
‘The Fed has faced more inflation than it expected, and policy makers need to be nimble, he added. But it will take several Fed meetings to organize the debate over tapering its bond-purchase program, he said.’
What’s going on?
I’ve been warning my subscribers that a correction is likely. Not that we’ve even got one yet. Global markets, including the Aussie market, are at or very close to all-time highs.
The reason for my concern is that ‘everyone’ thinks inflation is back. Rising inflation means prices of everything, including shares, go up, right? That seems to be the thinking.
The problem is, we are not in a period of rising secular (long-term) inflation. Rather, my view is that we have been experiencing a period of ‘reflation’ driven by massive fiscal and monetary policy in response to COVID. Add to that significant supply chain disruptions, and the short-term effect on prices has been extreme.
But it’s a reflationary effect, not a shift to a structural inflationary environment.
But prices are rising, you say. So, what’s the bloody difference!
Well, put simply, reflation is transitory inflation. Without ongoing government support, the global economy will shift back to a disinflationary/deflationary stance.
And we might be at the early stages of such a shift now.
Although having said that, there is no need to get too carried away with any particular viewpoint. When faced with uncertainty, humans create narratives to try and make sense of things. More than likely, these narratives are wrong. But they make a good story, so we stick with them anyway.
So keep in mind this whole inflation/reflation/deflation argument is just an attempt to tell a story about an unknowable future.
If I’m right about the reflation story, you’ll see the global economy start to slow, and stock markets move lower into the second half as shares price in this weaker economic environment.
Of course, much of this viewpoint depends on the actions of policymakers, especially the Fed. Right now, the Fed is responding to the inflationary narrative and making murmurs about raising rates in the distant future. That’s enough to spook the market.
But, it’s only very early days. Markets haven’t even put in a decent correction yet.
So, to see where things are at as we approach the halfway point of the year (yes, 2021 is nearly half done already!), let’s look at a few charts.
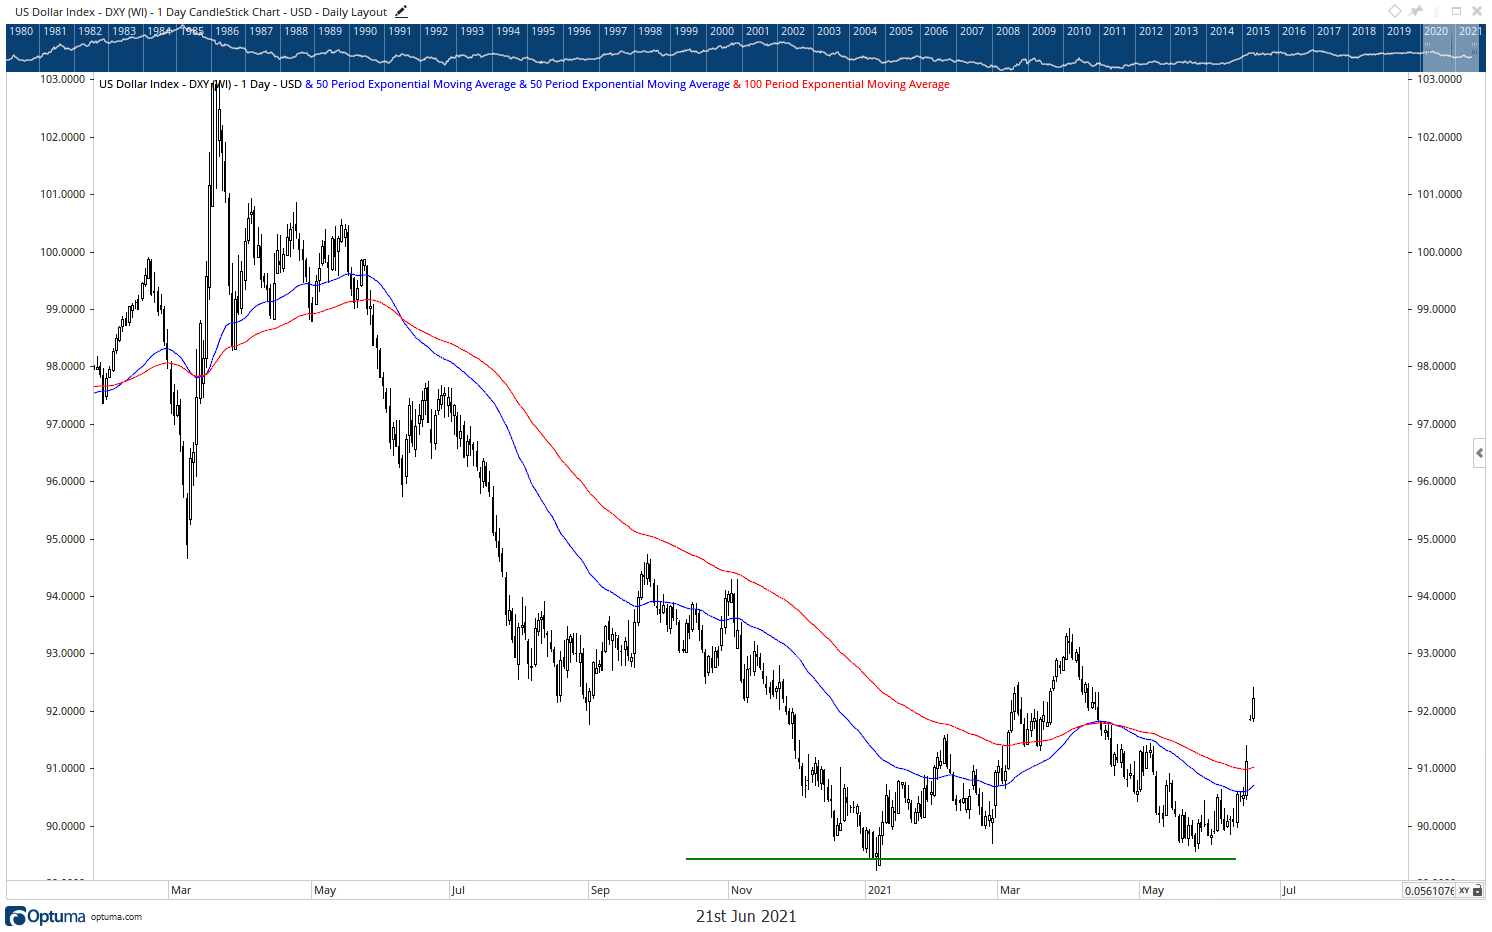
One of the most important is the US Dollar Index. After looking like it could break down to new lows just a few weeks ago, it has surged higher in the past few sessions.
It’s obviously in response to the Fed’s recent language on the removal of support. The question is whether a new upward trend is underway.
As you can see, after peaking in March last year, the dollar declined sharply. It made a low in January this year and has been bottoming for the past six months.
A rising dollar means one of two things: An outperforming US economy (and relatively higher interest rates) that sucks in global capital, or a financial market deleveraging as speculative capital exits the market.
One is bullish, the other bearish for asset prices. My guess is that as the Fed makes noises about tightening, the market sees this as bearish for the economy and asset prices and are unwinding speculative positions.
|
|
| Source: Optuma |
As I’ve mentioned a few times previously, the bond market never bought the secular inflation argument. US 10-year bond yields peaked at the end of March at around 1.75%. On Friday, they finished the session at 1.43%.
Falling bond yields indicate a slowing economy and/or falling (not rising) inflationary pressures.
A common argument for low bond yields has been ‘But the Fed is buying so many and holding them lower’. But if that were the case, and the Fed was supporting the market, their recent announcements should see yields heading higher.
That’s clearly not the case…
There are two other charts I want to show you that indicate the inflation surge is over for now…
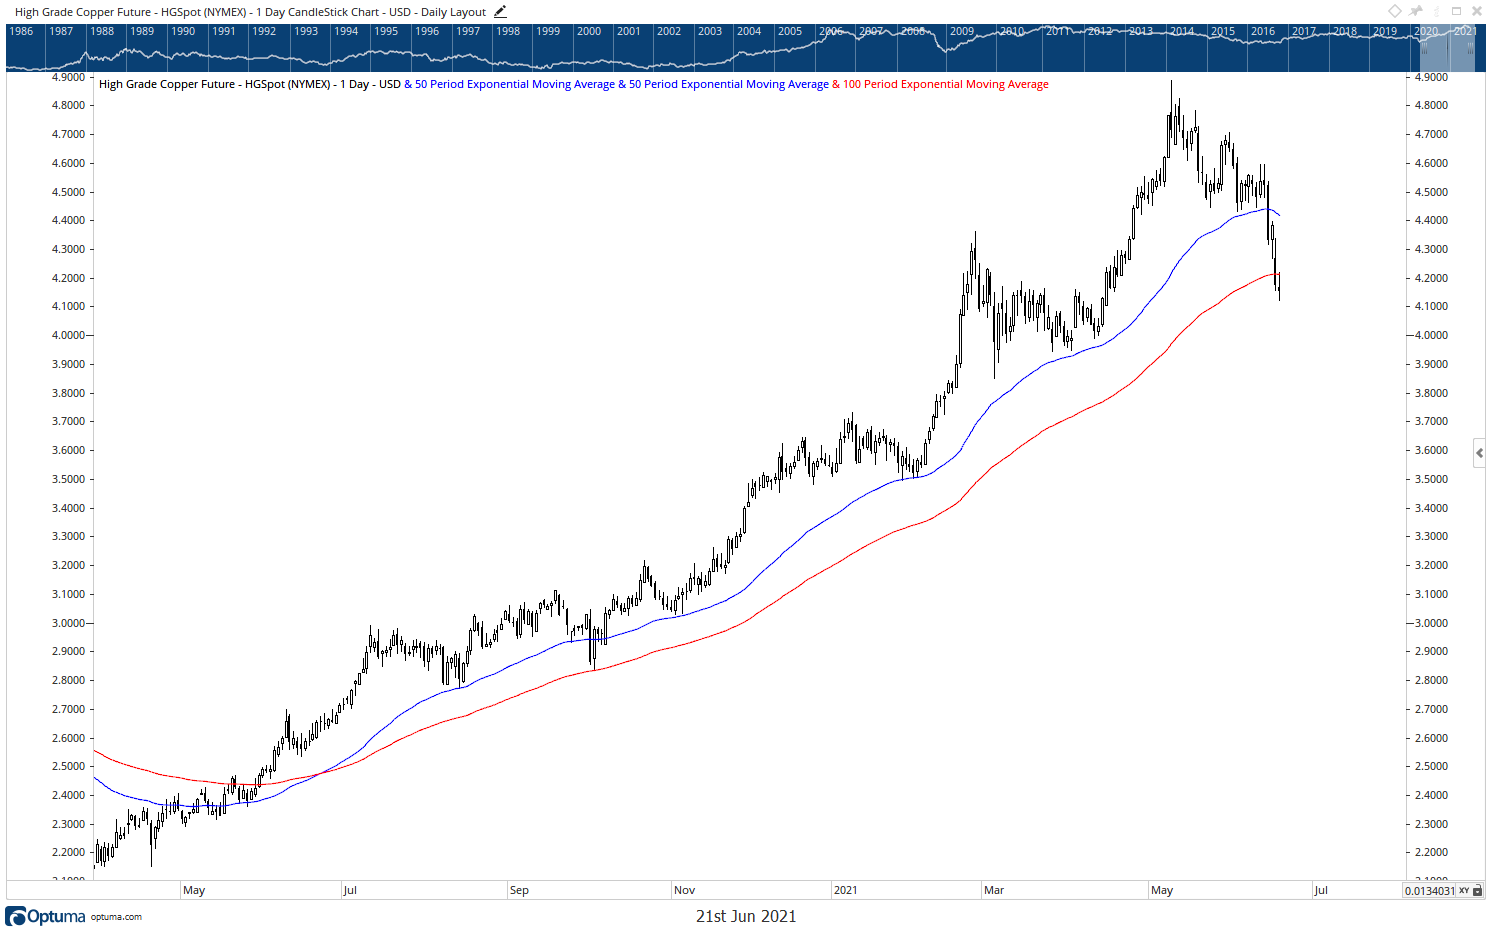
First, copper. It’s down around 15% from its highs. Granted, it’s had a massive run since the March 2020 low, and a correction shouldn’t be a surprise. But it will be worth keeping a close eye on in the next few months. A break below support around the $4 area would suggest a deflationary environment is unfolding.
|
|
| Source: Optuma |
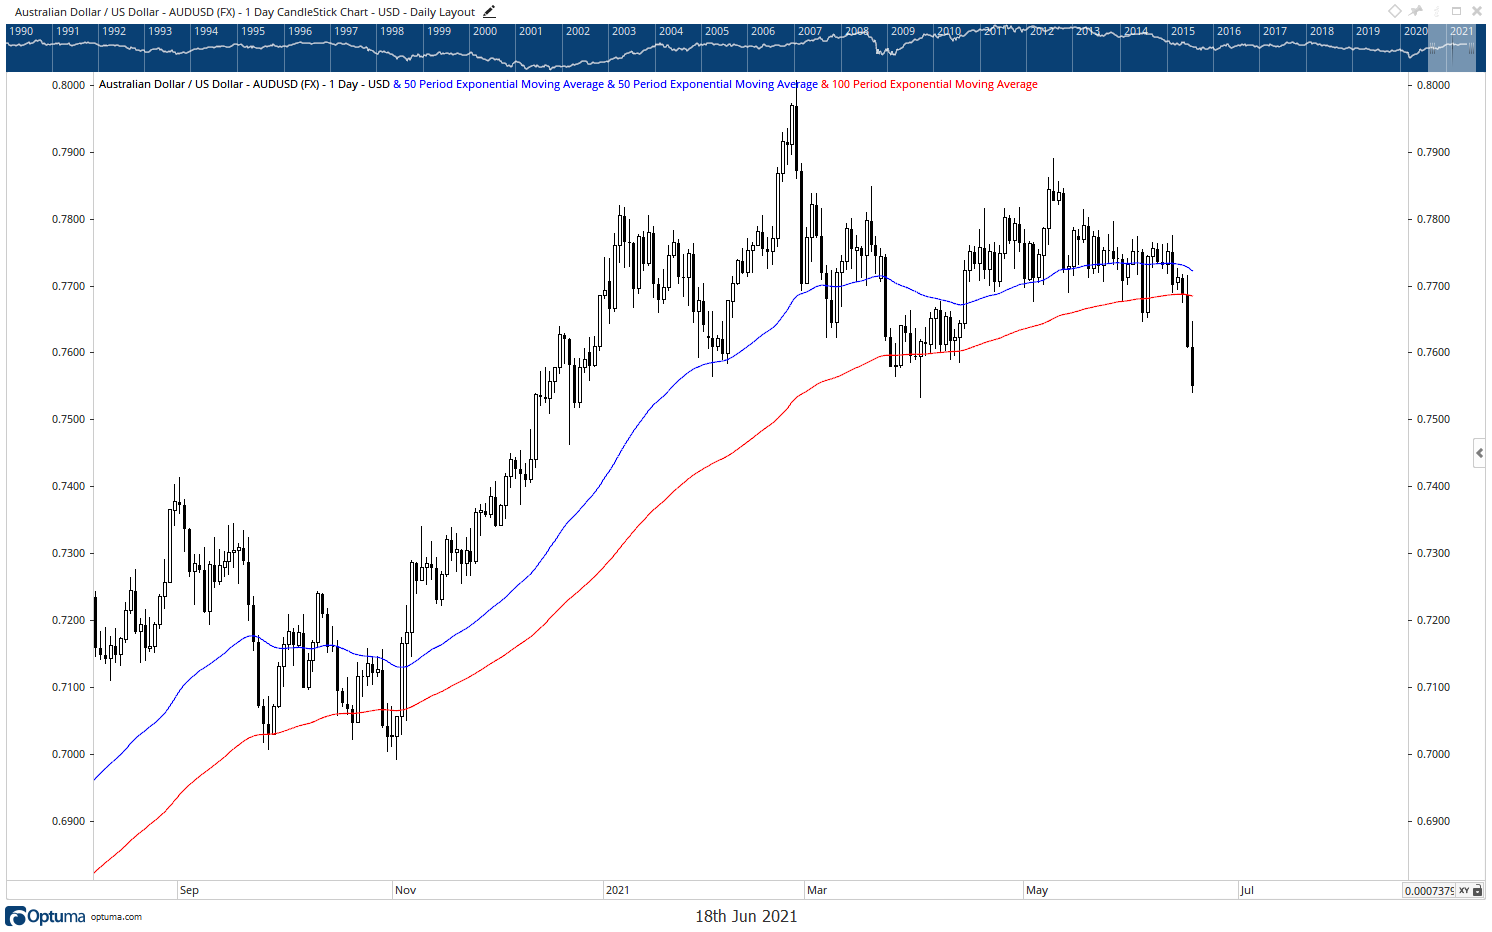
And then there is the Aussie dollar. It fell to its lowest point in Friday’s US trading session since December last year (see chart below). The Aussie is a great barometer for global economic activity. Like US bond yields, the Aussie peaked in March at around 80 US cents. It’s now below 75.
A little bounce here wouldn’t surprise, but it looks like a shift in trend to the downside.
|
|
| Source: Optuma |
Finally, let’s look at gold.
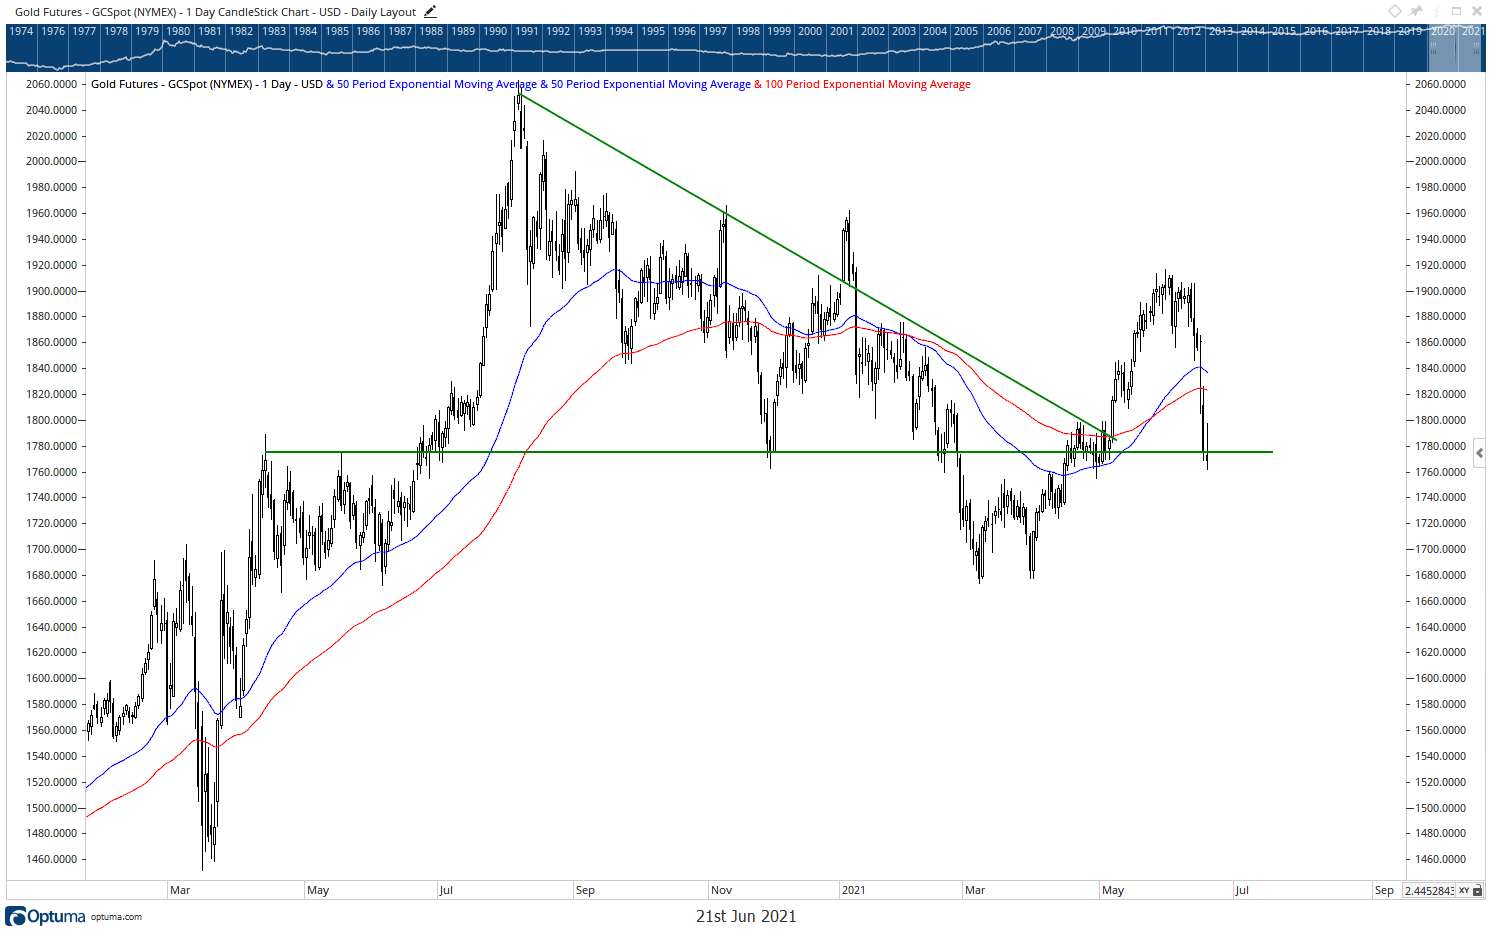
Gold sold off with all the other ‘inflation-sensitive’ assets. It went from nearly US$1,920 an ounce a few weeks ago, back down to support at around US$1,770.
|
|
| Source: Optuma |
Interestingly, real long-term yields in the US have declined while the gold price has corrected. This is an unusual occurrence. Gold normally rises when real yields (nominal yields minus inflation) fall.
This suggests a buying opportunity for gold.
Best,
 |
Greg Canavan,
For The Daily Reckoning Australia
PS: One thing I didn’t mention is Bitcoin [BTC]. It dropped to US$29,000 at one point in recent trade before rising back over US$30,000. I suspect a buying opportunity is brewing here too.


