
In today’s Money Weekend…the widening distribution…Newcrest Mining Ltd weekly chart…trading is all about staying on the front foot at all times…and more…
I introduced you to the concept of the widening distribution last week (if you didn’t read the article you can find it here).
The widening distribution
|
|
| Source: Port Phillip Publishing |
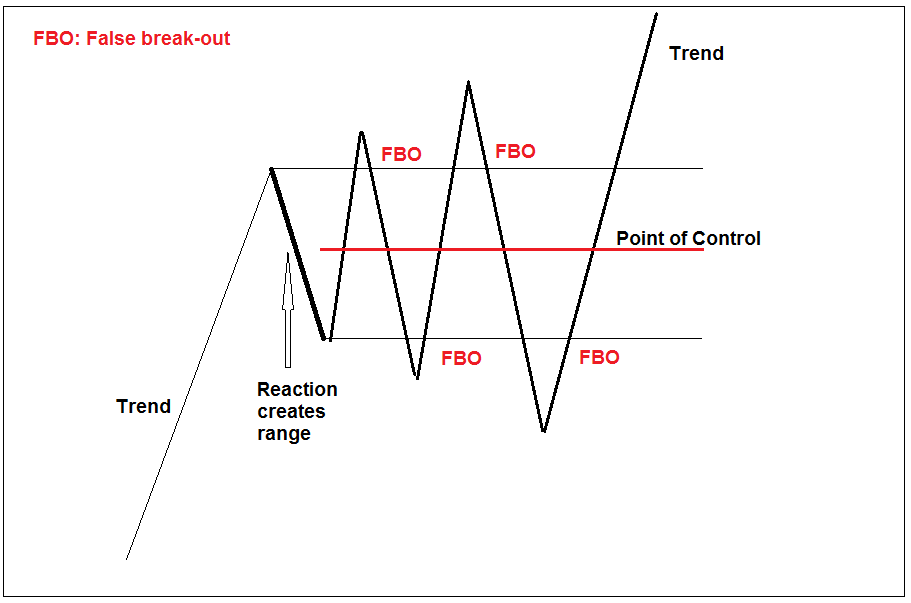
It would be easy to dismiss the pattern as an expanding triangle as classical technical analysis calls it and be done with it.
But the fact is if you dive deeply into how these patterns form and understand the mathematical relationships, you can enter trades with great risk/reward.
Remember that I said the reason they form is because traders place their stop-losses outside the current range whether long or short, and the market is great at tripping the stop-losses and then returning to the range rather than continuing to trend.
How to buy into the NEXT battery boom. Download your free report.
What if I told you that there are also areas within the range where prices often change direction and head back to the Point of Control (POC)?
Would that help you to plan a trade?
When I see a large correction of a prevailing trend I will make calculations based on the correction looking for the buy and sell zones of the range.
The retracement levels that I use are 12.5–25% and 75–87.5%. Make a note of those levels. They are incredibly important, and most traders don’t realise it.
Obviously, you need to answer the question of what a reversal looks like before you can decide when to trade. I have my answer to that question, which I will tell you over the coming weeks.
But for now, we just need to focus on the fact that there are calculations that you can make based on past price action that help you to plan high-probability trades.
Here is a quick list of a few of the characteristics of widening distributions that I use to help me make trading decisions:
- Amateurs buy in the top half and sell short in the bottom half
- Amateurs are uncomfortable at the POC
- Market gravitates back to the POC often to shake out traders
- Size of the false break is related to the size of the initial range
- Once prices hit double the size of the range the distribution is over
- The best entry point is 61.8% outside the range against the trend and 25% outside the range is also useful
- Fading the false breaks is a powerful strategy based on risk/reward
- There are areas within the range that often see reversals to the POC — they are known as buy and sell zones and the calculations are 12.5%–25% and 75%–87.5% retracements of the initial range
- Calculations for buy and sell zones within a range also work for retracement of waves in a trend
- Prices will revisit the POC for one last time before blasting off in a new trend
- You can use the characteristic of mean reversion to lower your average entry price
- After about five false breaks of the range, the probabilities increase that a continuation or reversal of the trend is close
There is an immense amount of information that I have given you in the list above.
It may not make much sense to you right now, but I’m sure there are a few traders who are already seeing the possibilities inherent in these structures.
Let’s have a look at Newcrest Mining Ltd [ASX:NCM] and see how it has been trading over the last couple of years.
Newcrest Mining Ltd weekly chart
|
|
| Source: CQG Integrated Client |
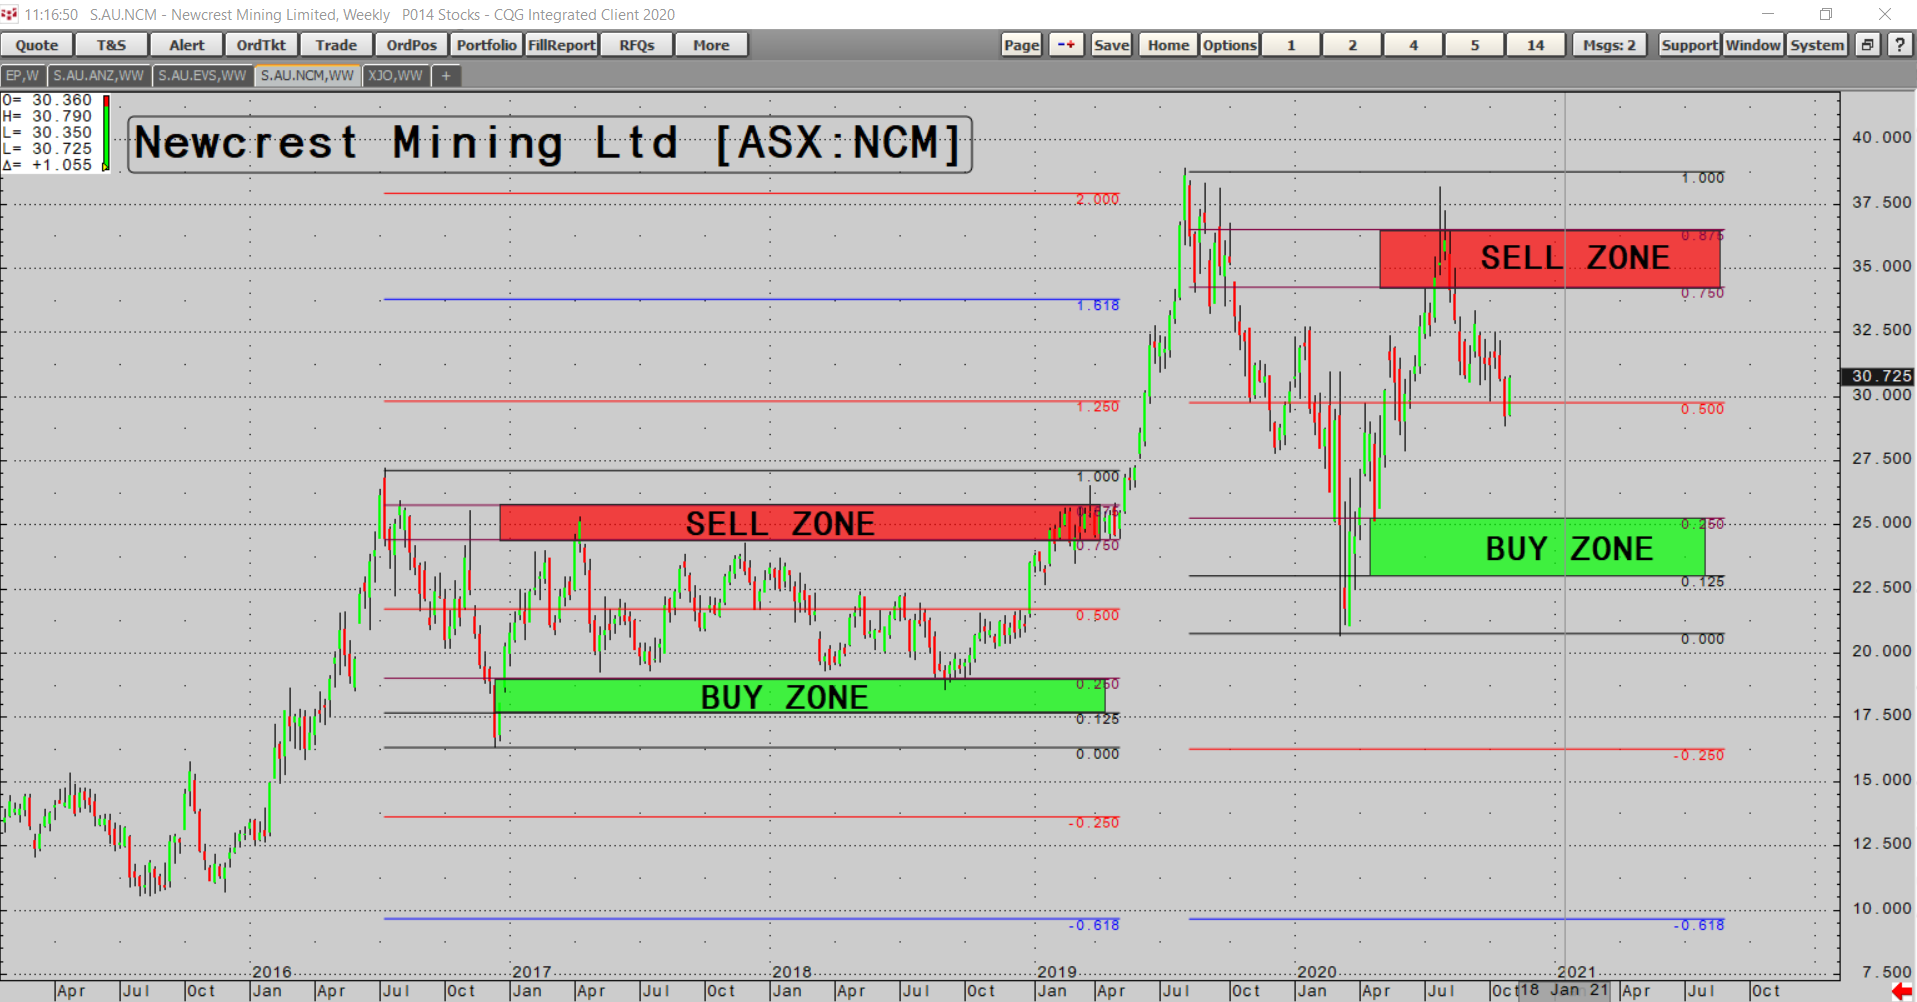
In this example of a distribution forming, the price has been trending higher for a number of years and I am making the calculations based on the large corrections against the trend.
You can see that there are many examples during 2017–18 where prices changed direction within the buy and sell zone of the range and returned to the POC.
There is another clear example in July–August this year, where prices were rejected from the sell zone of the range and have returned to the POC.
The things I am telling you can be used in trading. Members of my trading service Pivot Trader bought Newcrest Mining during the crash at $22.80 and took a third profit at the POC of the range and another third profit in the sell zone of the range just before the big sell-off.
So, they have taken a large amount of profit and remain long a third of the position with an average entry price that is well below where prices are trading now.
I am considering going back to a full position in Newcrest Mining due to the big jump in gold prices after the US election.
If we had just bought the stock at $22.80 and held on to all of it, we would have been stressing out during the recent sell-off rather than planning how to take advantage of the weakness.
Trading is all about staying on the front foot at all times.
My method of using mean reversion to the POC as the initial target means that we quickly move from risking our initial capital to owning a free option to see what’s coming next.
Rather than fretting over prices jumping all over the place, we take some profit quickly and adjust the stop-loss to a point where we will breakeven on the whole trade.
From that point on we will either breakeven or make money. The stress disappears and the fun begins.
Regards,
 |
Murray Dawes,
For Money Weekend
PS: The Next Afterpay? Discover three promising Aussie fintechs that are currently trading below $1. Click here to learn more.

Comments