
The century-long rhythmic swing from under-to-over-to-under in Margin-Adjusted PE (MAPE) for the S&P 500 Index has begun its rotation to lower levels:
|
|
| Source: Hussman Strategic Advisors |
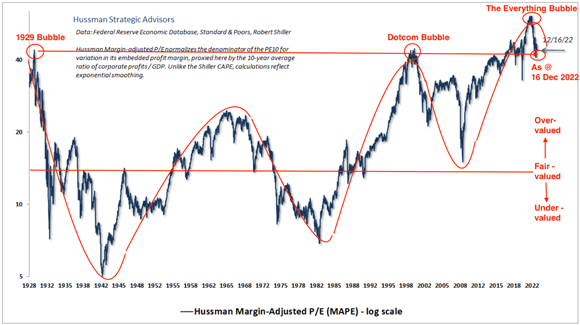
How far will it go?
Perhaps it could come to rest in the lows of 1932, or the all-time low during the Second World War, or maybe where it finished in 1982 after a decade of high inflation.
How long will it take to complete this cyclical rotation?
Will it be a short, sharp drop, like the one experienced in 2008/09 or could we see it grind lower over a much longer period…perhaps a decade or more?
None of us knows what pathway the greatest asset bubble in history is destined to take in its quest to restore value.
But what we do know is valuations NEVER stay on a permanently HIGH plateau or in a permanently LOW valley.
The cycle is always moving (via a saw-toothed pattern) in one direction or the other.
The latest reading of the MAPE has it resting on the same valuation latitude as the 1929 and dotcom bubble peaks. Unless this time is completely different — and valuations remain permanently high — there’s a lot more downside in our future.
If you’re at a stage in life where a Big Loss of capital and/or purchasing power would adversely impact your lifestyle, then you need to seriously factor in the prospect of what the change in valuation direction means for you.
My guess is most people have no idea what the other (far more brutal) side of this cycle is like.
Why?
Look at the last time the cycle ventured into the undervalued zone…it was in 1982…40 years ago.
The four-decade-long rotation from under-to-over valued had its setbacks in 2000–02 and 2008–09. However, thanks to central bank intervention, the recoveries were swift. The cycle regained its balance and powered on to higher highs.
If the inflation cycle has also changed from falling for 40 years to now rising, central banks won’t be able to add as much stimulatory fuel to the system.
Suppressing interest rates for years, together with excessive levels of money printing, would risk turning inflationary embers into an inferno.
The world we’ve grown up in has ill-equipped us for a future that’s shaping to be vastly different from anything we’ve experienced.
Cycles always rotate.
Some take longer than others to go full circle.
Unfortunately, far too many people fail to realise/recognise or acknowledge the rhythmic patterns that can decide the course of our lives.
The Big Loss can come in different guises
The most obvious Big Loss can come from a market crash.
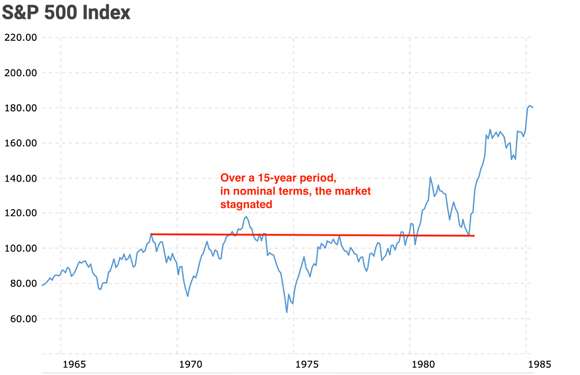
However, there is a far more insidious way to suffer a Big Loss. One that comes from a combination of stagnating asset prices AND higher inflation.
From 1967–82, the US share market in nominal (NOT inflation adjusted) terms went on a jagged journey to nowhere…a US$100,000 invested in 1967 was still worth US$100,000 in 1982:
|
|
| Source: Macrotrends |
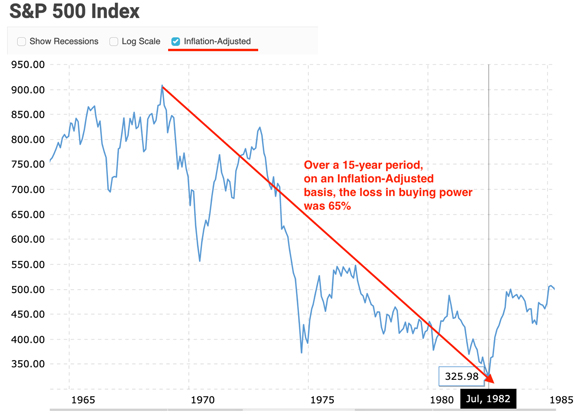
However, in inflation adjusted value, the 1967 US$100k LOST two-thirds of its buying power in over that 15-year period of asset price stagnation:
|
|
| Source: Macrotrends |
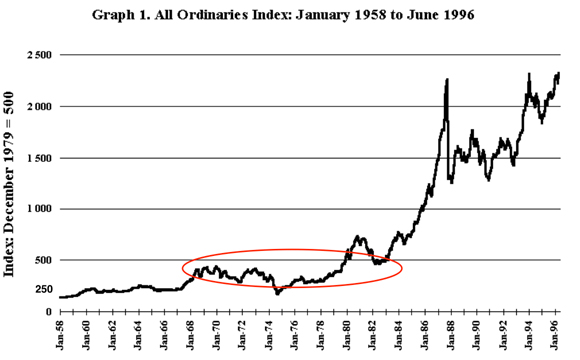
And, if you think this experience was unique to the US market only, then you’re mistaken.
Where the US market goes, the rest of us tend to follow…the All Ordinaries Index also stagnated over this period AND Australia also battled higher inflation:
|
|
| Source: Library of the Australian Parliament |
If we add another zero to the US$100k, an investor with US$1 million today most likely thinks their future looks OK. But what if the next 15 years are a repeat of 1967–82?
That US$1 million will only buy what US$350k does today.
Ah, yes, you have a diversified portfolio…so all your eggs aren’t in the share market basket.
True. But have the other assets in the ‘diversified’ portfolio also been beneficiaries of the 40-year upward-trending valuation cycle?
When balanced is actually unbalanced
In my book How Much Bull can Investors Bear?, Chapter 11 was titled ‘Debunking the Myths’.
Here’s an edited version of…‘Myth #6 — Don’t put all your eggs in one basket…’
‘We‘ve all heard the saying “don’t put all your eggs in one basket”.
‘It’s one for the ages. Timeless advice. Or is it?
‘The diversification espoused by Benjamin Graham and Harry Markowitz was for an era when markets sent back reasonably reliable signals of risk versus reward.
‘Not so these days. All the market wants these days is confirmation the Fed has its back. Fundamentals count for diddly.
‘That US$8 trillion [M2 in 2018] that’s now been printed into existence since 2008 has had to go somewhere.
‘Any guesses? Try these for size.
‘Bonds. High yield securities. Shares. Property. Collectibles. Infrastructure. Private Equity. Venture capital.
‘Running in tandem with the asset price inflation (created by the rising tide of cheap and abundant money) is a derivatives market measured in the hundreds of trillions of dollars — no one knows exactly how big this weapon of mass destruction is…that’s frightening.
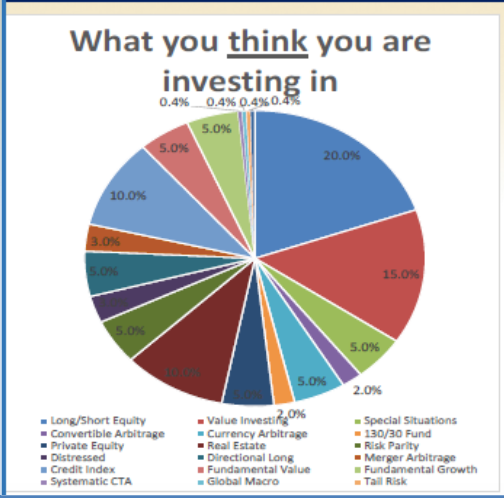
‘These days a diversified fund might look something like this…a wagon wheel of supposedly uncorrelated assets.
|
|
| Source: 720 Global |
‘In fact, what you are actually buying into is this:
|
|
| Source: 720 Global |
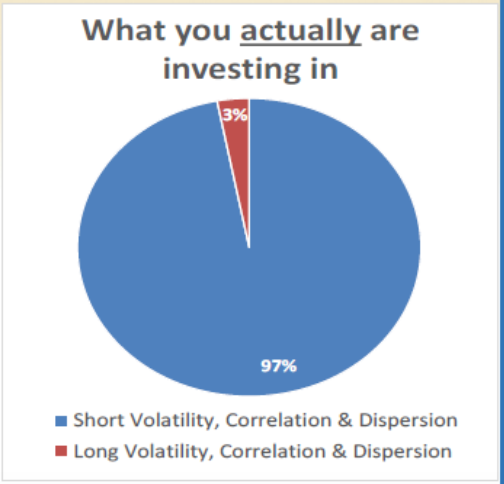
‘Diversification amounts to nought if the capital behind those asset classes can be traced back to a single denominator…QE, zero interest rates and the chase for yield.
‘Central banks have floated all boats higher…with one exception. You guessed it — Cash.’
The first edition of How Much Bull can Investors Bear? was written in 2017.
The reason for making people aware of the lack of diversification in so-called Balanced portfolios — loaded with assets that were beneficiaries of the Fed’s asset pumping efforts — can be found in this excerpt from the Australian Financial Review (emphasis added):
‘Many Australians have some of their wealth invested in a balanced fund, which typically have roughly 60 per cent exposure to growth assets such as shares and property and the rest in lower-risk assets such as bonds and cash.’
A good percentage of Aussies have their superannuation and retirement savings in the default option…balanced fund.
Based on investing folklore, a professionally managed, well-diversified portfolio is considered a prudent approach to long-term wealth creation.
Unfortunately, this investing legend belongs to an era when price discovery was largely left to market forces.
Blatant asset price manipulation by central bankers has rendered this popular and widely accepted (but rarely questioned) concept obsolete…at least for now.
Perhaps, from the ruins of this bubble, we’ll see a re-emergence of a more legitimate price discovery process.
But that’s of little comfort to the problem confronting the ‘many Australians’ today.
They’re invested in portfolios that (contrary to what they’ve been led to believe) are highly concentrated in overvalued assets.
In November 2022, John Hussman published this chart on the Forecast (blue line) versus Actual (red line) per annum return (over a 12-year period) of the traditional balanced fund…60% shares, 30% US Treasury Bonds, and 10% Treasury Bills (cash).
There are periods of disconnect between the blue (forecast) and red (actual) lines — during times of market extremes — however, the red line eventually manages to entwine itself with the blue line.
The longer-term accuracy in the forecasting model (dating back to 1928) is fairly impressive:
|
|
| Source: Hussman Strategic Advisors |
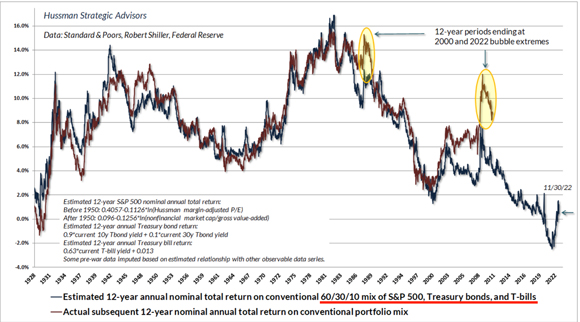
In early 2022, the forecast annual return for the next 12 years (January 2022 to December 2033) was…MINUS 2.29%.
PLEASE NOTE…this return is BEFORE product and adviser fees are deducted.
Which means you can reduce this number by another 1–2%…giving the investor, in all up performance, a return of MINUS 3.29% to MINUS 4.29% PER ANNUM.
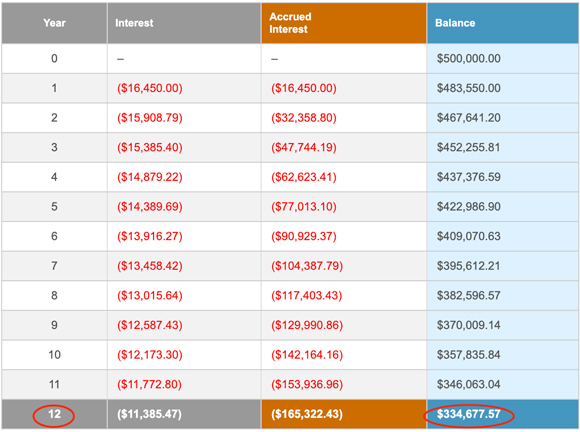
If we work on the ‘better’ return of MINUS 3.29% PER ANNUM over the next 12 years, here’s what that means for an investor with US$500k in the average US-balanced fund.
In late 2033, they’ll have US$334k…and, if our investor is a retiree, this number is before they’ve taken US$20–30k each year for living expenses:
|
|
| Source: The Calculator Site |
Admittedly, this dire forecast is for US investors.
But, as we know, what happens in the US does NOT stay in the US.
Lacklustre performance on US markets will — to a lesser or larger degree — be exported to global markets…including Australia.
Let’s venture into optimistic territory and say Aussie ‘balanced’ funds (after the deduction of fees) manage to eke out a zero to positive 1% per annum return over the next 12 years.
Our local market ‘good news’ spells bad news for:
a) Retirees seeking a return of 6–7% per annum to (fully or partially) fund living expenses.
OR
b) Those close to retirement (next 10–15 years) looking to compound an existing balance into a much higher amount.
In 2022, the process to correct excessive valuations — in a number of asset classes — commenced.
But it’s far from finished.
Understanding the consequences of a cyclical rotation in long-term trends has never been more critical to your financial well-being.
If you haven’t already, be sure to check out my four-day strategy session with Bill Bonner on ‘Avoiding the Big Loss’. Today’s session is a good one, centred around solutions…what you can actually do about this world of pain ahead. Sign up for free here.
Regards,
 |
Vern Gowdie,
Editor, The Daily Reckoning Australia
