
We have an exciting project launching today at Fat Tail Investment Research.
I’ve been talking about it all week.
It’s called Project: Kill Bill.
Click on the link above to learn more about why US entrepreneur James Altucher thinks now is the time to take advantage of the Trump administration’s deregulatory agenda.
James will be working with our man on the ground, Charlie Ormond, here in Australia.
That’s why Murray Dawes and I got Charlie on today’s edition of the Closing Bell podcast.
Right now, markets are in flux. The short term swings are hard to read. But these periods can provide fruitful long term returns.
I can speak from experience. Back in 2022 and 2023 I bought bitcoin for my Self Managed Super Fund. It was about $30,000 per BTC then. It’s nearly $150,000 now.
I’ve still got it.
So I’m just as curious to see what Charlie has to say, and what he’s working on.
He didn’t disappoint.
Click below to tune in today’s Closing Bell…
Best wishes,
 |
Callum Newman,
Editor, Small-Cap Systems and Australian Small-Cap Investigator
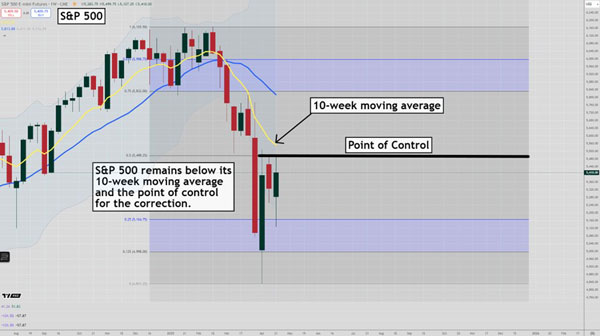
Murray’s Chart of the Day
– S&P 500 Weekly Chart
| |
| Source: Tradingview |
There are many uses for technical analysis, but my favourite is that it stops me from doing dumb things.
By creating a model of market behaviour that outlines where risks are high, you can sidestep many money losing trades.
That’s not to say you know what’s coming next.
It may be as simple as working out that the odds are evenly balanced, so trading one way or the other is a bad idea.
We have seen a huge fall over the last month, so of course every woman and her cat are trying to work out whether the worst is over and it’s time to buy.
Buy too early and you face serious losses if markets swoon again. Buy too late and you miss out on the easy gains.
Daily volatility remains elevated, so it is easy to become convinced that markets are going to head one way or the other.
Surely a five percent rally in a day proves that the worst is over and now it’s risk-on baby?
Not so fast.
When I look at the weekly chart for the S&P 500 shown above, there are a few red flags that curb my enthusiasm.
When a market is weak it will often retest the midpoint of the range created in the correction and then meet stiff selling pressure.
Also during a weekly downtrend, while prices remain below the fast moving average (10-week EMA) the odds of further downside are elevated.
Also we still haven’t seen a weekly buy pivot confirmed.
So there is nothing in the weekly chart that tells us it is time to buy.
That is not to say next week won’t see a big rally which confirms a move above the point of control and 10-week moving average and also confirms a weekly buy pivot.
All those things may happen.
All I am saying is that those things haven’t happened yet, so I have to remain on the defensive until proven otherwise.
Regards,
 |
Murray Dawes,
Editor, Retirement Trader and Fat Tail Microcaps

Comments