We saw some violent moves across markets last week.
The kind of extreme price swings that make you sit up and take notice.
At the centre of the volatility was Japan.
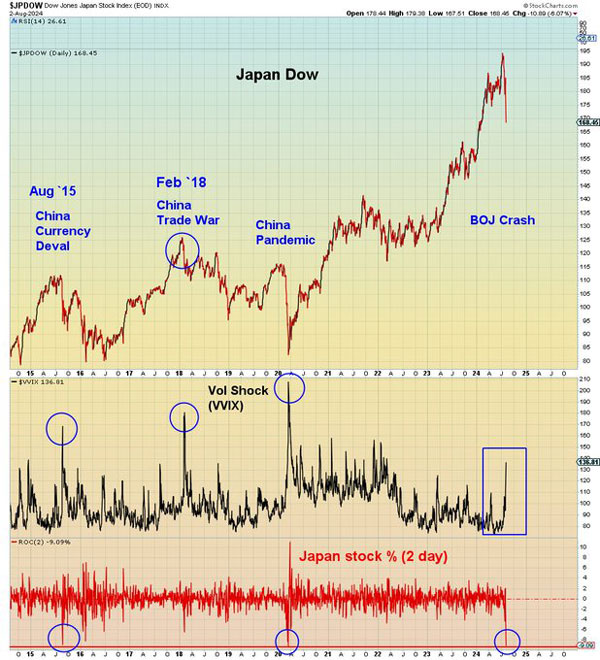
The Japanese market plummeted 6% on Friday, its worst one-day move in eight years.
| |
| Source: MAC 10 |
And this morning it’s crashed a further 6%, triggering circuit breaker rules that have suspended trading.
At the same time, the Japanese Yen rallied to multi-month highs.
What’s going on?
And why does the Japanese market matter so much to global markets?
Let me explain…
Rush for the exits
It appears the famous Japanese ‘carry-trade’ strategy is starting to unwind.
The ‘carry trade’ is when investors borrow in Japanese Yen at low interest rates and invest it at higher rates of return in other countries (or just in Japan too).
For a long time, Japan has kept rates close to zero, supporting this strategy.
At the same time, surging US tech stocks (like the Mag 7) and high-yielding US government bonds provided great returns for carry trade investors.
Think about it…
Until last week, a global hedge fund could borrow at close to zero in Japan and earn around 5% in ultra-safe US government bonds.
Or if they wanted a bit more risk, 16% this year so far in the US Nasdaq index.
It’s money for jam!
Until it isn’t….
You see, things changed sharply last week.
On Wednesday, the Japanese central bank increased rates for only the second time in 17 years.
From 0.1% to 0.25%.
That doesn’t sound too dramatic, but a few other developments fuelled the fire.
On Thursday, we got an unexpectedly bad unemployment figure in the US.
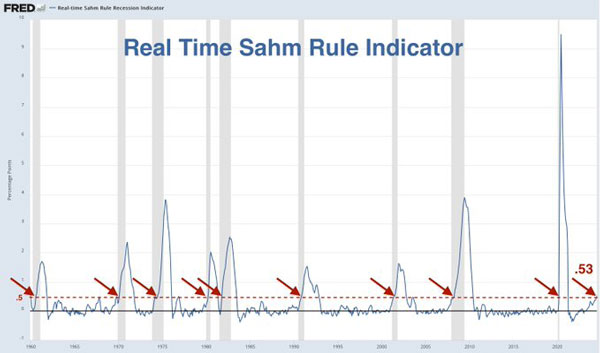
A 4.3% reading (against an expected 4.1%) triggered an indicator known as the Sahm Rule, suggesting the US was already in a recession.
| |
| Source: FRED |
This indicator has predicted every recession since 1953, and the bond market reacted savagely.
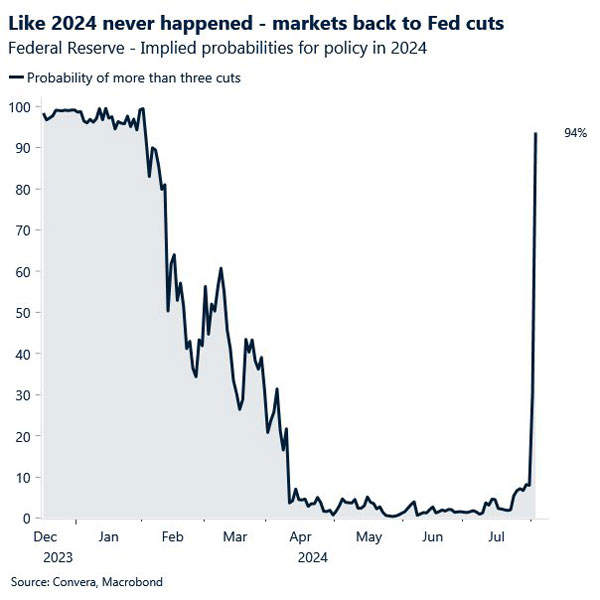
The odds have suddenly swung in favour of six rate cuts over the next four Fed meetings.
Believe me, at the start of last week, no one was forecasting this:
| |
| Source: Macrobond |
The Japanese Yen rallied 3% further on Friday against the dollar on this news and is up almost 8% in just three weeks.
This makes things even worse for carry trade investors.
Remember, because they’ve borrowed in Yen, their loans get more expensive to pay back when the Yen rises in value versus whatever currency they’ve invested in.
In a double whammy, as the stock markets fall, carry trade investors in equities start to lose money on their investments, too.
In short, the interest rate, the exchange rate and the investment returns are all going the wrong way for carry trade investments.
Right now, it’s a mad rush for the exits for hedge funds caught in this bind!
And I think it was the trigger for last week’s steep sell-off.
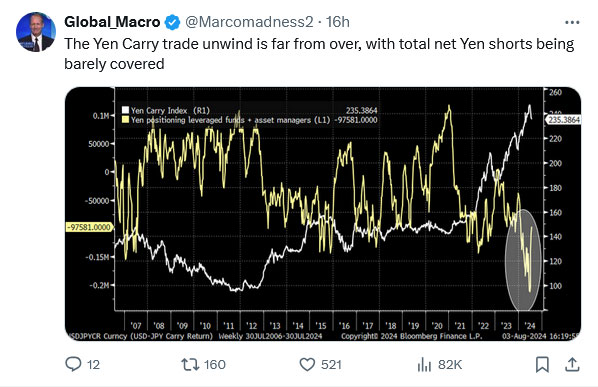
Unfortunately, as chief investment officer Ben Emons noted, there’s still a fair way to go:
| |
| Source: Global Macro |
It could get ugly this week.
As Kinsale Trading noted in a report on Friday:
‘The yen carry trade has been used to fund bull markets in virtually every asset over the years,” … and if it is “starting to reverse, it has negative implications for stocks and other risk assets.’
That ‘forced’ selling can partially explain last week’s violent stock sell-offs.
But it wasn’t the only factor in play…
There were signs the AI-led bull market was finally running out of steam.
Both Microsoft and Intel missed earnings expectations in cloud computing, hinting at a slowdown in overall demand.
This snowballed into a broader market sell-off, especially in momentum plays.
Another bad sign?
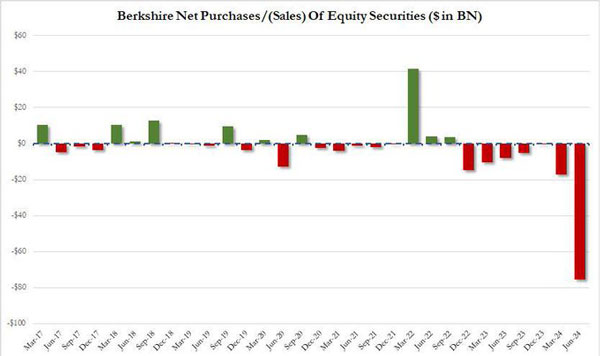
It appears the great Warren Buffett — famously noted as a value investor — has also been selling down stocks over Q2:
| |
| Source: Zero Hedge |
This is the most (in dollar terms) he has ever sold in just one quarter.
Ok, that’s the bad news, but there are still reasons to be optimistic…
A case for optimism
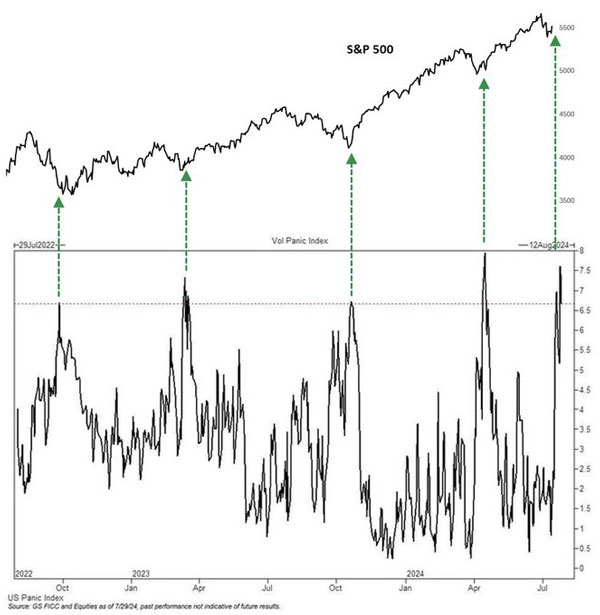
At some point, the carry trade unwind will reach a crescendo of selling and at that point — when there’s peak panic — things will probably reverse suddenly.
It’s the usual way these things play out.
Check out this chart:
| |
| Source: Goldman Sachs |
This is the Goldman Sachs ‘panic index’ (bottom) versus the stock market (S&P 500) price (top).
It’s only a two-year view, but as you can see, points of peak panic usually mark the low in an ongoing uptrend.
That might sound pretty unsophisticated, but it’s generally true.
Also, as I pointed out, central banks are likely to react quickly to any panic.
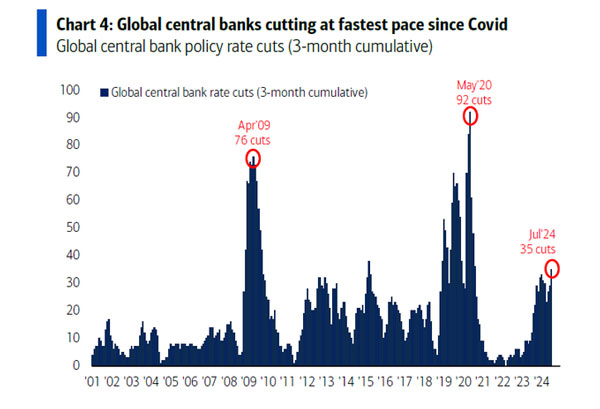
Beyond the US, globally, other central banks are already starting to stimulate their economies:
| |
| Source: Bank of America |
Of course, this could cause inflation to re-ignite.
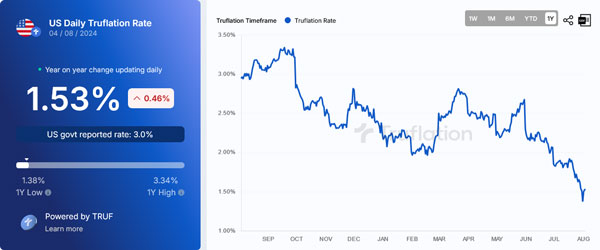
But some ‘unofficial’ numbers from Truflation show that things may have dramatically improved on the front over the past two months:
| |
| Source: Truflation |
If this is correct, it gives central banks much more wriggle room to support the economy if needed.
Despite the current pullback, the overall story is still very rosy on the tech front.
Sure, the Big Tech companies like Meta (META), Apple ( AAPL), Amazon (AMZN), Alphabet (GOOGL), and others reported mixed quarterly numbers over the past two weeks.
But the common theme among all of them generally was: ‘We’re going to keep spending more and more money on AI… a lot more.’
That spending should support large sectors of the tech market.
And in the longer run, I believe the efficiencies of AI will drive the stock market for decades to come — even if it takes longer to get there than the market hoped.
Long story short, things could get volatile this week, but I remain optimistic about the big picture.
In my opinion, any short-term selling pressure will provide buying opportunities in the right stocks.
But to navigate such times, you need to have a proper plan.
My colleague, professional trader Murray Dawes, has the perfect system for trading such volatile markets.
And in Saturday’s Closing Bell, he discussed one trade idea using his time-tested methods.
Regards,
 |
Ryan Dinse,
Editor, Crypto Capital and Alpha Tech Trader


Comments