When it comes to the doom and gloom in markets RIGHT NOW, there is a bright spot on the horizon…
Commodities.
Despite enormous falls in the US market over the last few weeks, if you’re holding large-cap mining stocks, you’re probably faring pretty well. This was the message I conveyed to readers of The Insider last week.
It’s one reason Australia’s leading index, the S&P ASX 200, continues to pivot away from the US S&P 500.
Why?
While both indices represent the largest companies for their respective countries, it’s Australia’s heavy weighting toward mining stocks that is giving it an edge against the tech-dominant US index.
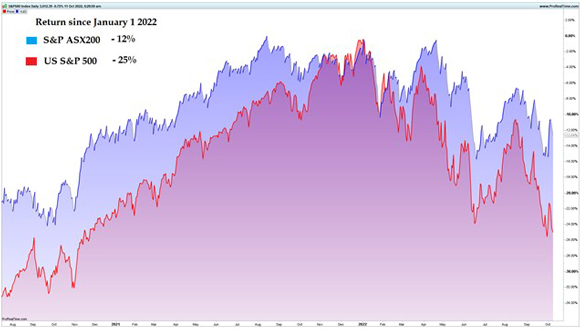
As you can see from the chart below, the 12% decline in the Aussie looks reasonable when you compare it to the huge 25% sell-off in US markets since the beginning of the year:
2022 Performance: S&P ASX 200 versus US S&P 500
|
|
|
Source: ProRealTime |
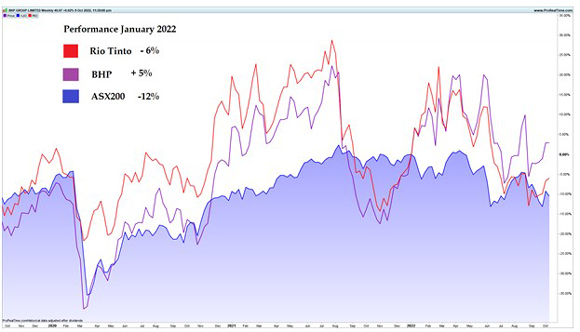
Overlaying Australia’s two largest diversified mining companies indicates why the Aussie index might be holding up quite well. BHP [ASX:BHP] is strongly ahead of the ASX 200, up 5% for the year, and Rio Tinto [ASX:RIO] is down a moderate 6%.
The weighting of these two stocks (within the index), in addition to other large-cap miners, has given the Aussie market a boost relative to global indices:
2022 Performance: S&P ASX 200 versus RIO and BHP
|
|
|
Source: ProRealTime |
From the strongest to the weakest
In every boom-and-bust story, there’s always a winner and a loser.
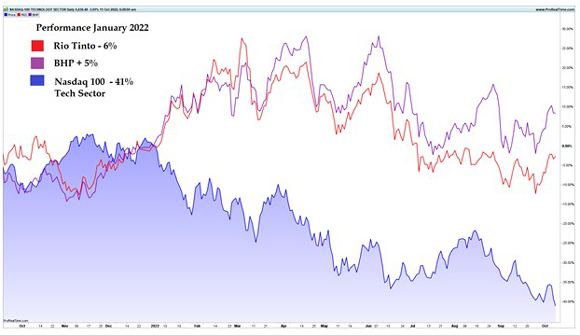
It’s not often you see BHP or RIO stock prices overlayed against the Nasdaq Tech Index, but I thought it would offer an interesting comparison to see the diverging markets and highlight the stark contrast.
I’ve used the Nasdaq 100, as it holds the world’s 100 largest tech firms. As you can see, it’s been a brutal year for the group, down a whopping 41%. But the story for our two largest diversified miners is very different, as you can see below:
2022 Performance: Nasdaq 100 Tech Sector versus RIO and BHP
|
|
|
Source: ProRealTime |
It demonstrates a point I made in The Daily Recking Australia just last month; this global bear market is squarely focused on overvalued tech stocks. It’s why I drew the comparison to the dotcom bubble of 2000.
What that bubble showed us a little more than 20 years ago is that bear markets affect all equities. But the impact is not the same across the board.
In a reflection of today’s market, as back then, the ASX 200 — with its heavy weighting to ‘real asset stocks’ — performed well relative to its tech heavy US cousin.
But the trillion-dollar question everyone wants to know is, have we reached a bottom?
Rewind 22 years, and the Nasdaq Composite Index made an all-time high in February 2000. From there, it was all downhill.
This tech-heavy index proceeded to fall more than 75% over the following two years, making a final low in September 2002.
This crash would go down as one of the biggest booms to bust stories in financial history.
To date, that same index has fallen 32% from its new all-time high, recorded in December 2021.
As I’ll demonstrate below, there could be further pain on the way for tech investors.
The charts paint a bleak future for tech, but emerging opportunities for mining
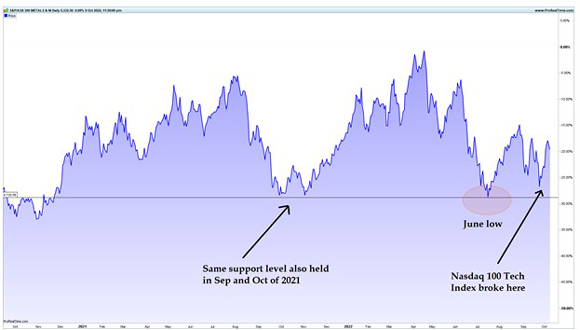
As tech declines, mining stocks continue to hold a very important support level.
As you might recall, all equities suffered a brutal sell-off mid-way through 2022. Most global indices (and stocks) made major lows around late June. These lows gave us a valuable reference for gauging future strength (or weakness) in the market.
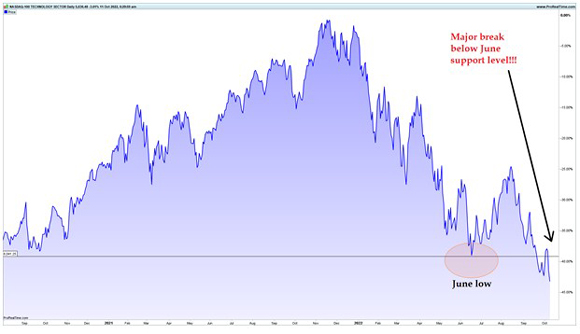
Bringing up the chart for the Nasdaq 100 Index below, you can see the all-important June level breaking.
This is an extremely weak signal indicating more pain is on its way for tech investors.
The index is now on its way to making yet another NEW low major low:
Nasdaq 100 Tech Sector
|
|
|
Source: ProRealTime |
On the other hand, the situation for resource stocks looks far more optimistic!
Using this same June low as a support reference, the mining sector is holding up well.
I’ve demonstrated this on the chart below using the ASX 300 Metals and Mining Index as a proxy for the mining industry at large:
ASX 300 Metals and Mining Index
|
|
|
Source: ProRealTime |
The comparison between the two sectors is a stark reminder that not all stocks perform terribly in a market sell-off.
But the key is to find stocks holding strength. This is where the opportunity rests, quite literally, waiting patiently for the market to turn bullish.
Sell-offs provide a two-fold advantage for savvy investors; they expose the weakest stocks while also highlighting the strongest opportunities.
Market gurus always claim that the best time to buy stocks is during a major market sell-off.
The key point they miss, however, is that in times like these, you should ONLY buy companies that are holding up against market pressure.
Buying any old stock in freefall (like most tech stocks right now) is like trying to catch a falling knife, and that’s not what I consider a value play for long-term investors.
Finding stocks with relative strength is.
If you are looking to take advantage of this market sell-off; identify the strongest stocks first.
Watch how they react to future market declines. Monitor their relative strength against other stocks or indices. Then, take any future market drop as an opportunity to add the position to your portfolio.
Right NOW, the strength is in mining.
Until then — happy hunting!
Regards,
|
|
James Cooper,
Editor, The Daily Reckoning Australia
PS: Stay tuned as next week I’ll be capping off the final issue of our special three-part series covering critical metals.

