
Thinking of an investment in ASX e-commerce stocks? Or are you thinking of an investment in traditional retail stocks?
We will take a look at both camps today and dive into the charts.
In the e-commerce camp are Kogan.com Ltd [ASX:KGN] and Temple & Webster Ltd [ASX:TPW], two e-commerce darlings.
In the second part, we will look at more traditional retailers such as Super Retail Group Ltd [ASX:SUL], Nick Scali Ltd [ASX:NCK], and JB Hi-Fi Ltd [ASX:JBH].
The punchline is that traditional retailers and e-commerce players can successfully co-exist in the market if the macro picture about consumer spending continues to improve.
Meaning, it’s not necessarily one or the other.
E-commerce stocks punching higher after Victorian lockdown fall
You can see the KGN share price below:
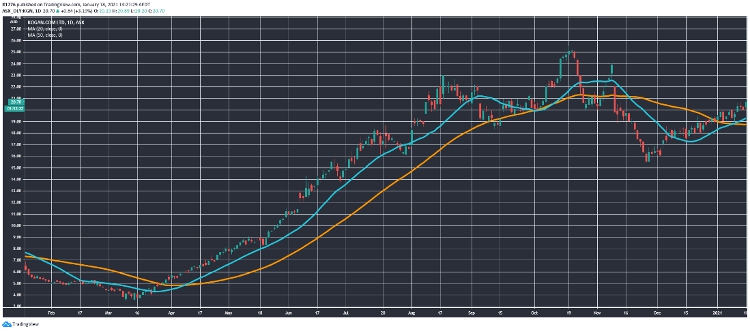
Source: Tradingview.com
And the TPW share price as well:
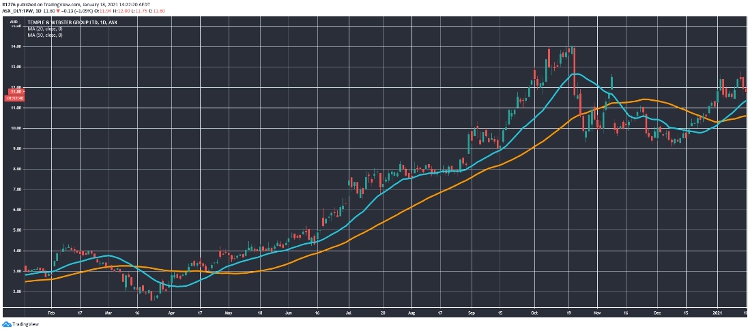
Source: Tradingview.com
I’d say those are pretty similar charts and here’s why…
The sharp fall around late October/November coincided with the easing of the Victorian lockdown.
Investors may’ve thought that the run was over, and that traditional brick-and-mortar retailers were back on the menu.
Competition back in the picture, so to speak.
But let’s look at how a trio of traditional retailers are doing.
Traditional retailers’ charts in context
You can see the SUL share price below:
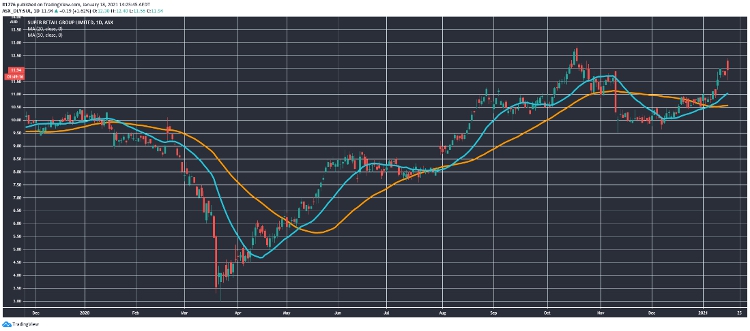
Source: Tradingview.com
The JBH share price here:
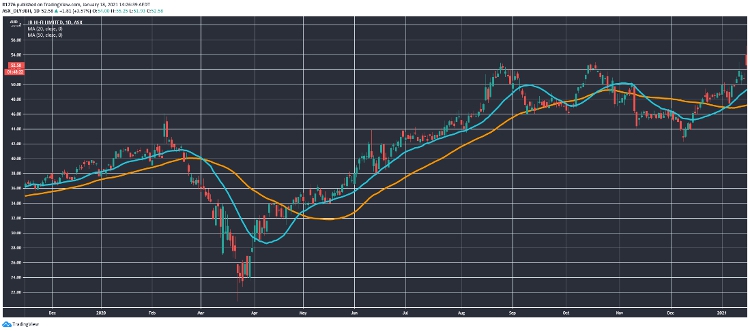
Source: Tradingview.com
And the NCK share price as well:
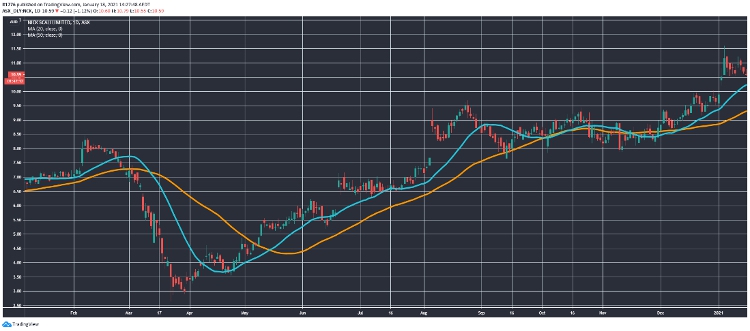
Source: Tradingview.com
Now what’s happening here?
First up, it could be value-hunting investors betting on a macro recovery lead by bargain basement RBA rates and a successful vaccine rollout.
Or in the case of NCK, a rise based on improving numbers coming out via trading updates and the launch of an online channel in April 2020.
Which brings me to my next point — which is that there is no longer a rigid distinction between e-commerce and retail. Successful retail companies will adapt and improve their online channels to suit demand driven by consumer sentiment.
There will be hybrids down the track, and pigeonholing is not a useful exercise.
Anyway, how are the macroeconomic trends going?
Macro picture not as bad as everyone thinks…
Take a look at these two charts from the RBA…
You’ve got this one:
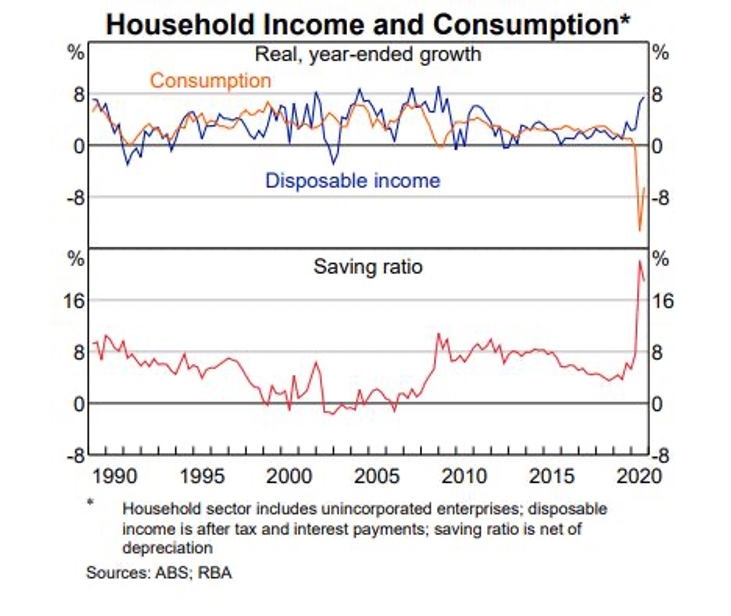
Source: RBA
And this one:
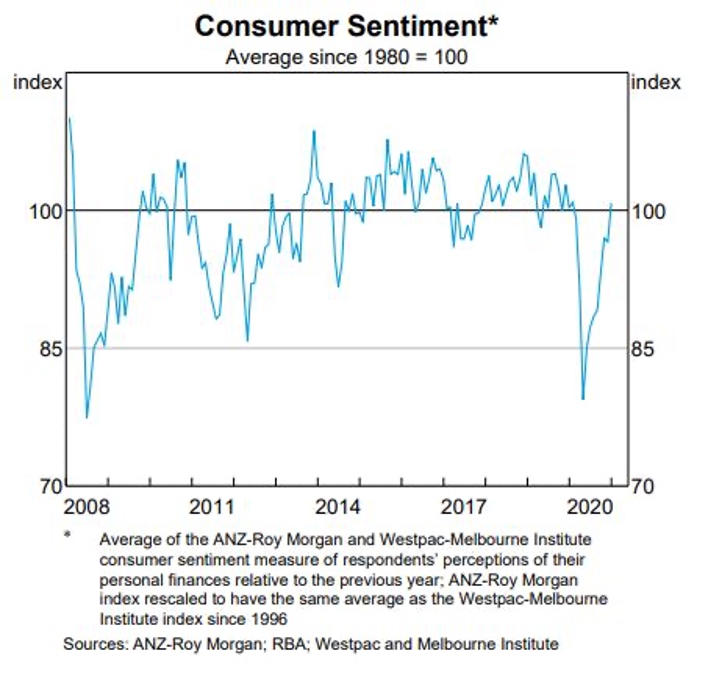
Source: RBA
Now there’s a lot of fear out there in the market, mixed up with a lot of greed as well.
It’s classic ‘bubbly’ market behaviour, but I wouldn’t say we are in a bubble.
In Australia, at least. Yet.
It’s almost contrarian to suggest at this stage that any pullback will be short-lived, at least in some circles.
And I think it will flow directly into the charts of these five companies I’ve just profiled.
Here’s what I’m seeing in these two charts:
- A resilient and confident Australian consumer
- Recovering consumption
- Perhaps importantly, a savings ratio that is primed to come down
Which means I think that even if the RBA doesn’t have any more ‘dry powder’ (unless it goes to negative-rate whacky town), the Australian consumer does.
The second-order effect of that could be that retail and e-commerce stocks continue to go up in the medium term.
Much to the bears’ consternation.
I discuss all of this in the video above
Check it out and be sure to subscribe to our YouTube channel if you like the insights.
Regards,
Lachlann Tierney,
For Money Morning

Comments