
Balance is defined by the Oxford Dictionary as ‘an even distribution of weight enabling someone or something to remain upright and steady’.
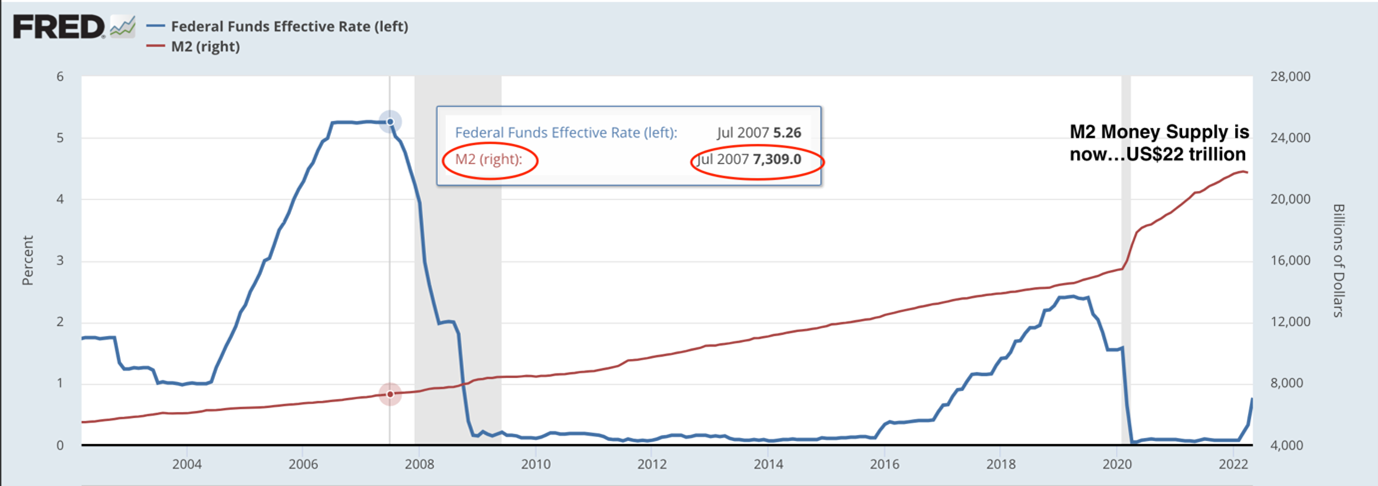
When this has been done for more than 14 years…reduced the Fed funds rate from 5.26% to (almost) zero AND trebled M2 money supply from US$7.3 trillion to US$22 trillion…
|
|
| Source: Federal Reserve Economic Data |
You are certain to get a decidedly unbalanced outcome. One where US household wealth-to-income, in both percentage AND dollar terms, is horribly out of whack with historical norms…(from the 9 May 2022 Gowdie Letter):
‘Going back to 1950, US household wealth (as a percentage of household income) has found a balance somewhere in the 520% to 560% range.
|
|
| Source: Federal Reserve Economic Data |
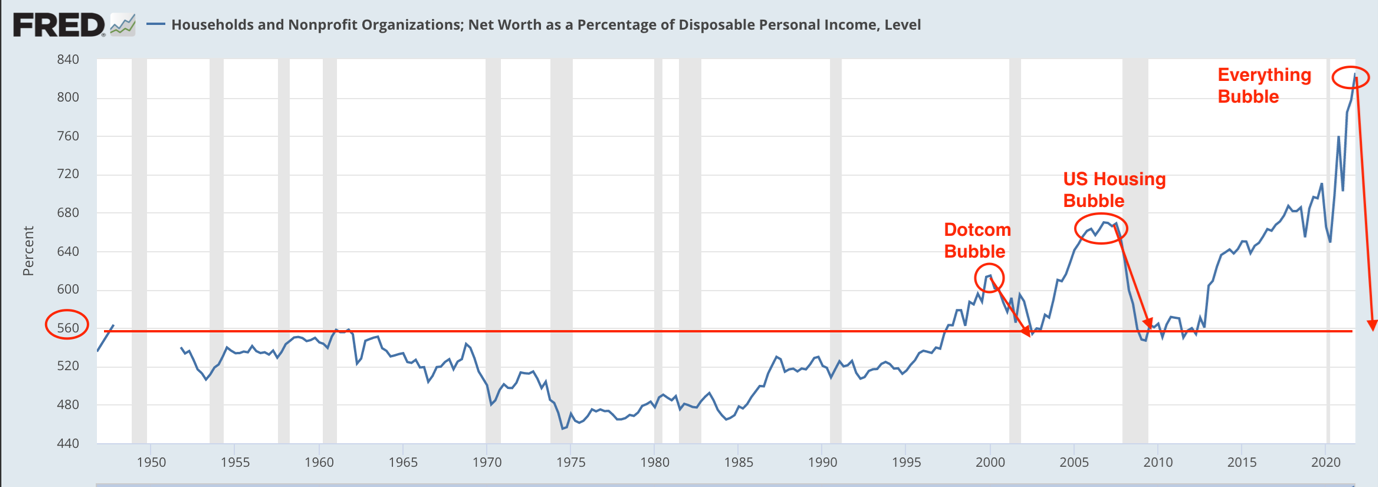
‘If the magnetism of the 560% line once again proves far more powerful than any central bank grand rescue plan, we are looking at US$50 trillion of wealth being vaporised…an amount equivalent to 220% of US GDP.’
|
|
| Source: Federal Reserve Economic Data |
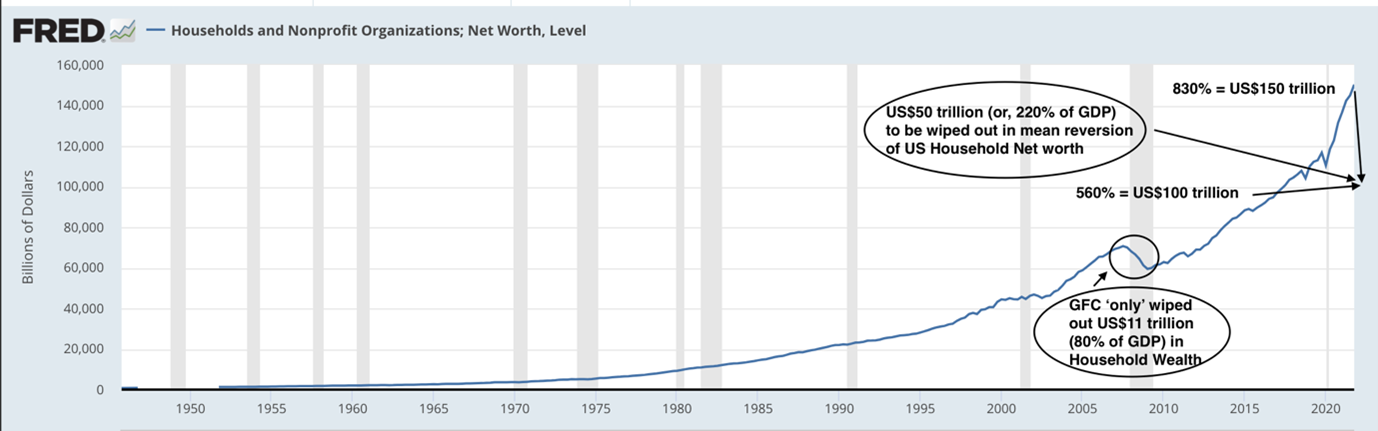
The everything bubble, in both size and structure, is unique. It’s a multi-asset and multi-generational phenomenon unlike any bubble we’ve seen before — or are ever likely to see again.
The uneven distribution in the weight of money — pouring into speculative assets, negative yielding bonds, oversubscribed junk bond offerings, real estate, private equity, and debt etc. — means the system is ultimately UNABLE to remain upright and/or steady. It must first teeter, then collapse.
Which is precisely the order of events we are going through now.
Practical application of past alerts
In recent weeks, I’ve found myself going through past content to use as examples of how alerts raised in the boom times are now having practical application in the bursting of this bubble.
In my book How Much Bull can Investors Bear?, Chapter 11 was titled ‘Debunking the myths’.
Here’s an edited version of ‘Myth #6 — Don’t put all your eggs in one basket’:
‘We’ve all heard the saying “don’t put all your eggs in one basket”.
‘It’s one for the ages. Timeless advice. Or is it?
‘The diversification espoused by Benjamin Graham and Harry Markowitz was for an era when markets sent back reasonably reliable signals of risk v reward.
‘Not so these days. All the market wants these days is confirmation the Fed has its back. Fundamentals count for diddly.
‘That US$8 trillion [M2 in 2018] that’s now been printed into existence since 2008 has had to go somewhere.
‘Any guesses? Try these for size.
‘Bonds. High yield securities. Shares. Property. Collectibles. Infrastructure. Private Equity. Venture capital.
‘Running in tandem with the asset price inflation (created by the rising tide of cheap and abundant money) is a derivatives market measured in the hundreds of trillions of dollars — no one knows exactly how big this weapon of mass destruction is…that’s frightening.
‘These days a diversified fund might look something like this…a wagon wheel of supposedly uncorrelated assets.
|
|
| Source: 720 Global |
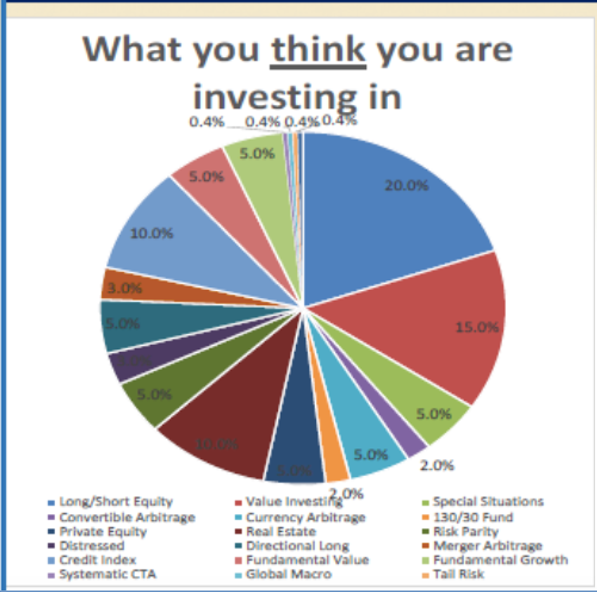
‘In fact, what you are actually buying into is this:
|
|
| Source: 720 Global |
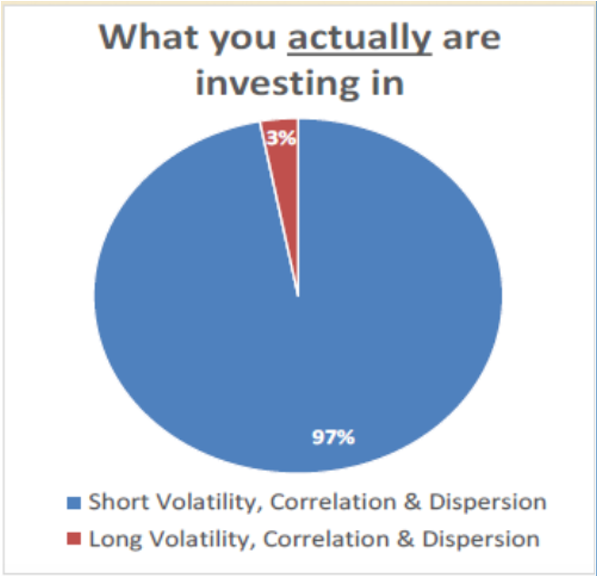
‘Diversification amounts to nought if the capital behind those asset classes can be traced back to a single denominator…QE, zero interest rates and the chase for yield.
‘Central banks have floated all boats higher…with one exception. You guessed it — cash.’
The first edition of How Much Bull can Investors Bear? was written in 2017.
The reason for making people aware of the lack of diversification in so-called ‘balanced portfolios’ — loaded with assets that were beneficiaries of the Fed’s asset pumping efforts — can be found in this excerpt from the Australian Financial Review on 19 May 2022:
‘Many Australians have some of their wealth invested in a balanced fund, which typically have roughly 60 per cent exposure to growth assets such as shares and property and the rest in lower-risk assets such as bonds and cash.’
A good percentage of Aussies have their superannuation and retirement savings in the default option…balanced fund.
Based on investing folklore, a professionally managed, well-diversified portfolio is considered a prudent approach to long-term wealth creation.
Unfortunately, this investing legend belongs to an era when price discovery was largely left to market forces.
Blatant asset price manipulation by central bankers has rendered this popular and widely accepted (but rarely questioned) concept obsolete…at least for now.
Perhaps, from the ruins of this bubble, we’ll see a re-emergence of a more legitimate price discovery process, but that’s of little value to the problem confronting many Australians today…they are invested in a portfolio that (contrary to what they’ve been led to believe) are highly concentrated in overvalued assets.
In early 2021, John Hussman published this chart on the forecast (blue line) versus actual (red line) per annum return, over a 12-year period of the traditional balanced fund…60% shares, 30% US Treasury bonds, and 10% Treasury bills (cash).
There are periods of disconnect between the blue and red lines — during times of market extremes — however, the red line eventually manages to entwine itself with the blue line. The longer-term accuracy in the forecasting model (dating back to 1928) is fairly impressive.
|
|
| Source: Hussman Strategic Advisors |
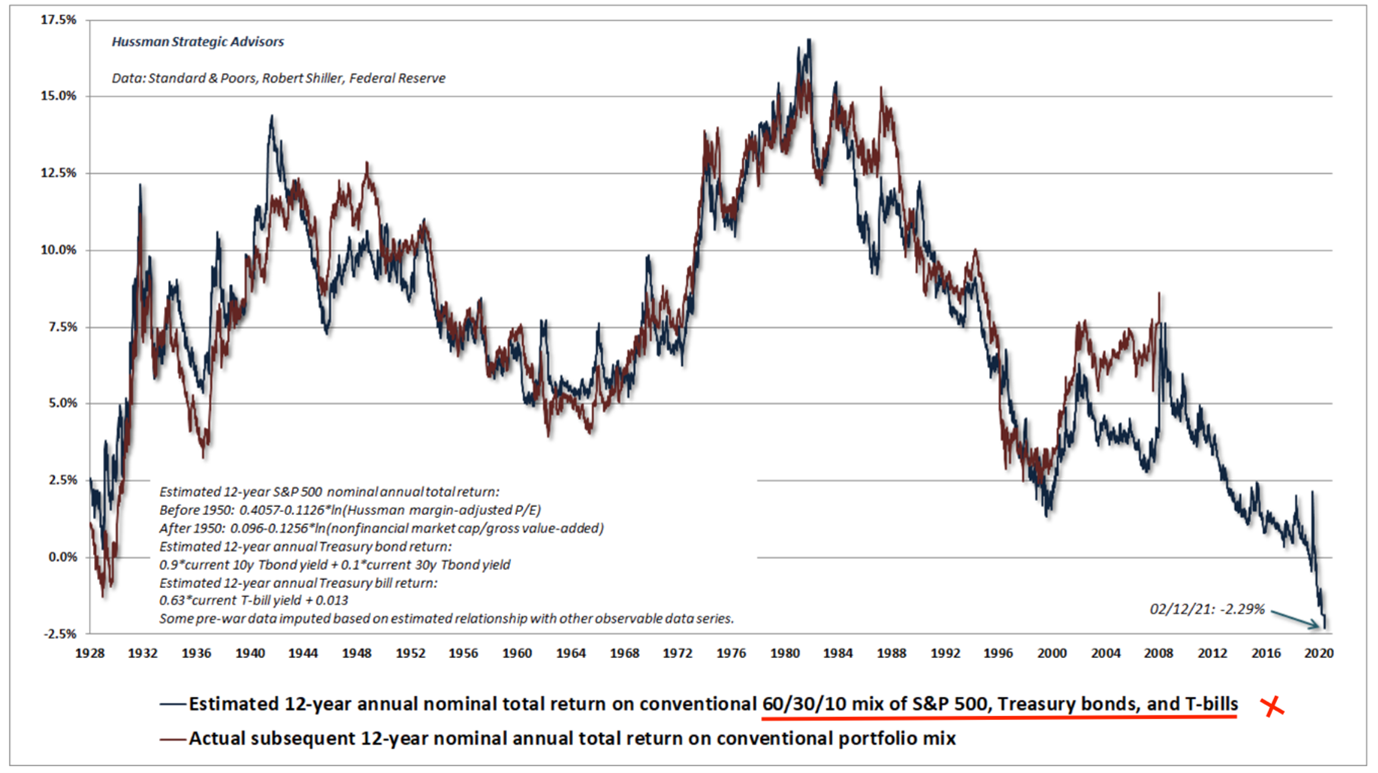
When the chart was published on 12 February 2021, the forecast annual return for the next 12 years (Feb 2021 to Feb 2032) was minus 2.29%.
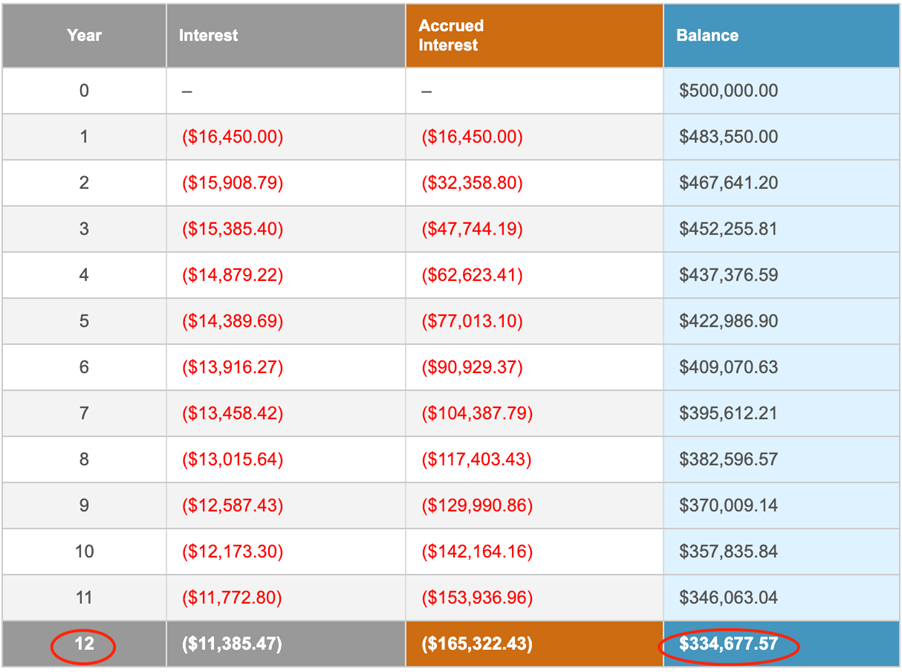
Please note…this return is before product and adviser fees are deducted. Which means you can reduce this number by 1–2%…giving the investor, in all up performance, a return of minus 3.29% to minus 4.29% per annum.
If we work on the ‘better’ return of minus 3.29% per annum over the next 12 years, here’s what that means for an investor with $500k in the average balanced fund…in 2032, they’ll have $334k…and, if our investor is a retiree, this number is before they take $20k–30k each year for living expenses:
|
|
| Source: The Calculator Site |
Admittedly, this dire forecast is for US investors.
But, as we know, what happens in the US doesn’t stay in the US.
Lacklustre performance on US markets will — to a lesser or larger degree — be exported to global markets…including Australia.
Let’s venture into optimistic territory and say Aussie ‘balanced’ funds (after the deduction of fees) manage to eke out a zero to positive 1% per annum return over the next 12 years.
Our local market ‘good news’ spells bad news for:
a) Retirees seeking a return of 6–7% per annum to (fully or partially) fund living expenses
OR
b) Those close to retirement (next 10–15 years) looking to compound an existing balance into a much higher amount
In early 2021, I’m guessing the average US (or Aussie) investor would’ve been sceptical of Hussman’s (highly accurate) forecasting model.
And that scepticism would’ve become even more so as 2021 progressed.
Last year, the S&P 500 continued to climb and interest rate suppression kept bond yields low (producing capital gains). Contrary to Hussman’s model, balanced funds delivered solid gains.
This time was different. Hussman’s model was broken. Out of date. A relic of markets past.
Ah…but when the calendar flipped over to 2022, so too did the switch on asset price growth.
The red line has had a change of course — a rendezvous with the blue line is in its future.
The following is the year-to-date performance of major US share indices, various bonds (high yield, municipal, and US Treasuries), listed real estate, and the asset that’s NOT included in balanced funds, gold.
For the investments you may not be familiar with, here’s a legend and links:
[ASX:HYG] — iShares iBoxx $ High Yield Corporate Bond ETF
[ASX:MUB] — iShares National Muni Bond ETF
[ASX:XLRE] — Real Estate Select Sector SPDR Fund
[ASX:TLT] — iShares 20+ Year Treasury Bond ETF
|
|
| Source: MSA |
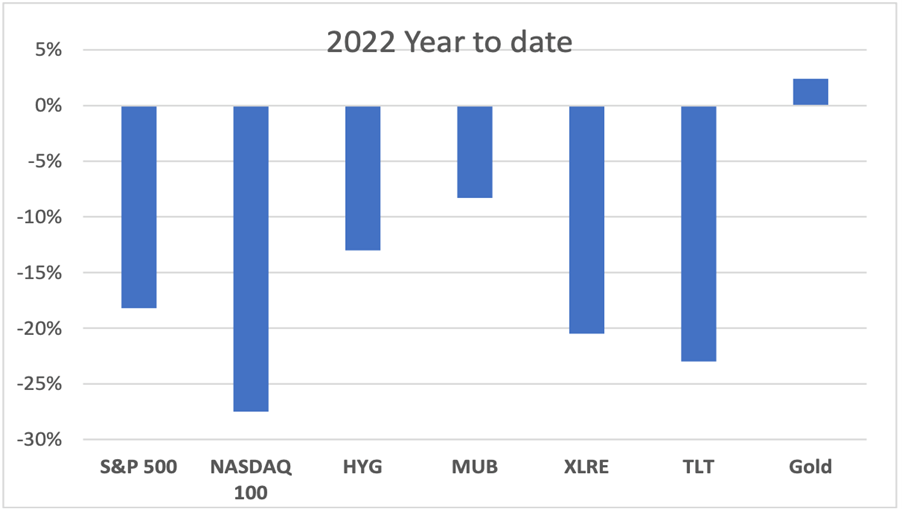
90% (60% shares and 30% bonds) of the traditional 60/30/10 mix is in negative territory — and this bear market has only just started.
Why?
Because the 90% was artificially inflated by the creation of excessive money supply and suppressed interest rates.
This is the exact scenario readers were alerted to in How Much Bull can Investors Bear?.
Now, with QT (quantitative tightening) we have asset price deflation…and people are wondering why the long-held tenet of diversification is no longer working.
Regards,
 |
Vern Gowdie,
Editor, The Daily Reckoning Australia
