The ASX 200 is on the move. Before Friday’s trading we were up 12% from Monday’s lows. But down 28% from the highs of last month.
Which matters more? Were the last few days of gains a turning point or a mere blip in the bear market?
And what about the level of the bounce? 5,000 on the ASX 200 featured as an important level of support or resistance in 2006, 2008, 2010, 2011, 2013, 2016, and again today.
Does this tell us anything?
Today, I stake out my own position. Not that I’m completely convinced myself. But the safer cause of action is clear if you look at where we’ve come from to determine where we’re going.
The first thing to understand is that bear markets have rallies. Big ones. March of 2008 saw a 15% spike in the ASX 200, for example. Before the real crash began.
If you agree that we are in a bear market, that makes stock market rallies like the current one a selling opportunity, not a buying one.
The problem is, the world has changed. And COVID-19 isn’t like anything we’ve seen before. Let’s look into both.
This is the third time that investors have been burned in a generation. 2000 and 2008 are still seared into our memories as investors. And we’re all a lot wiser now.
The current crash happened after the ASX 200 finally hit all-time highs for the first time since 2007. That only lasted a few months though.
[conversion type=”in_post”]
How many baby boomers will be willing to punt on the stock market again after all that disappointment? And if they don’t buy in, what will happen to market prices?
For those nearing retirement, the mantra ‘buy the dip’ is about to become ‘sell the rally’. Valuations, dividends, and P/E ratios have nothing to do with it. Grocery bills and retirement plans do. Retirees are looking at when to sell out, not buy in.
Then there’s the legions of the COVID-19 unemployed. This week, the statistics began to reveal their numbers for the first time. This chart from the US helps set the scene. It shows the amount of first-time jobless claimers going back to the ‘60s.
|
|
|
Source: Bloomberg |
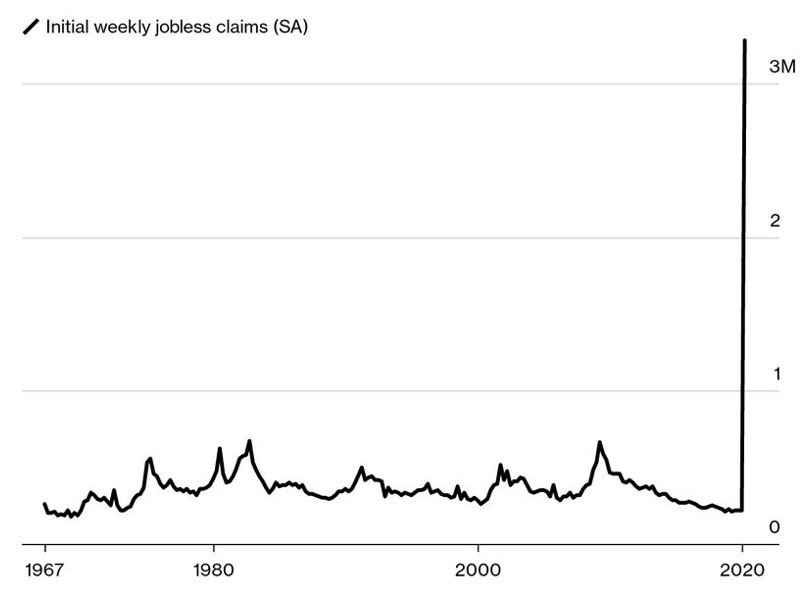
The world has never seen anything remotely like Thursday’s data release. But that stream is likely just the beginning.
Do you think those who lose their jobs will be contributing to pensions or buying stocks in coming weeks? Do you think the self-employed will be focusing on retirement savings in coming months?
Will those struggling look to sell their retirement savings and shares to meet bills and rent?
How many months will it take for our financial positions to revert back to normality — the point at which we even consider investing again?
And if all these people don’t buy in, I ask you again, what will happen to market prices?
Financial markets rely on inflows of funds from people planning to retire in order to balance the outflows of retirees selling to fund their lifestyle. That equation points to lower prices if you’ve got less people buying stocks and more selling.
At least, that’s my view. A more conventional analysis isn’t any different in the short run though.
The Market Ear blog put together a table of bear markets in the S&P 500. How long they last is the relevant bit for today.
|
|
|
Source: The Market Ear |
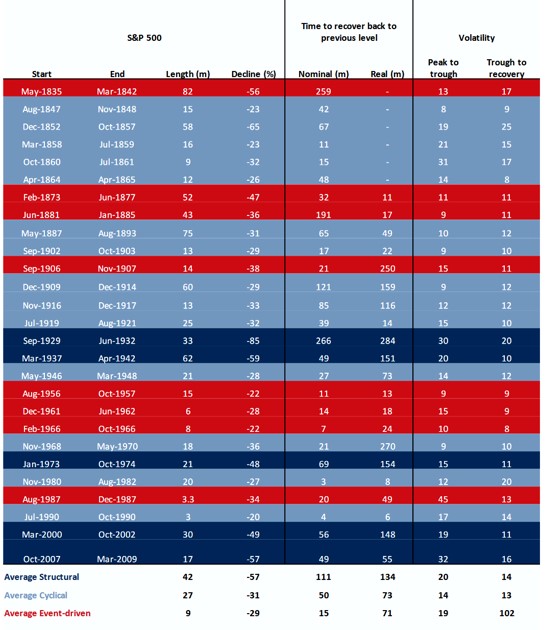
The average ‘event driven’ crash (like COVID-19) played out over six months, with two three-month outliers in 1987 and 1990.
Given the economic shock still revealing itself from COVID-19, I don’t think a one-month bear market is likely. And that means the worst is unlikely over for the stock market.
Financial markets are just part of the equation though. What about the economy itself?
We don’t know yet. But financial news blog ZeroHedge put together a summary which highlights the prediction pandemic striking investment banks:
‘First it was Goldman cutting its Q2 GDP to -5% just one week ago; then JPM quickly upstaged Goldman by slashing its own Q2 GDP forecast to -14%.
‘Then Goldman, which just last December said the US economy is “nearly recession-proof” decided to really show JPM who is boss and nearly doubled this dismal prediction, and on Friday predicted a great depression-like -24% crash in Q2 GDP.
‘And now, in this race to come up with the most apocalyptic GDP number imaginable, here comes Morgan Stanley which expanded its former Q2 GDP -4% prediction nearly 8x to -30%, a number that would have seemed almost insane in isolation…if only it wasn’t for St. Louis Fed president James Bullard coming up with an absolutely staggering -50% worst case scenario earlier today.’
Goldman Sachs followed up with this according to The Market Ear blog:
‘We now expect global real GDP to contract by about 1% in 2020, which would be somewhat weaker than the year following the global financial crisis (GFC). The extent to which the global economy is experiencing not just a recession but a “sudden stop” becomes clearer when we focus on sequential numbers.
‘1. Based on the hard data for January/February activity in China, we now estimate that Q1 real GDP contracted 42% in terms of the quarter-on-quarter annualized rate (qoq ar).
‘2. With lockdowns and social distancing becoming pervasive elsewhere, we expect real GDP in the advanced economies to contract very sharply in Q2, including a 24% drop in the United States that would be 2½ times as large as the previous postwar record.’
A 42% decline!?
To be clear, that’s actually a 10.5% decline for a quarter. The Americans like to quadruple their quarterly economic data to make it look bigger. They call it ‘annualising’. But the current quarter is not exactly a typical one that’ll last all year…
The Atlantic magazine simplified the economic analysis by declaring that this isn’t a recession but ‘An Ice Age’. Nobody argues about the details of those, after all…
Don’t forget that GDP measures flows, not stocks. It’s economic activity, not a measure of stuff. That means we can get it back quickly. But it is still economic activity gone missing. And debts need to be paid.
Debt ratings agency S&P expects ‘a surge in defaults, with a default rate on nonfinancial corporates in the US that may rise above 10 percent and into the high single digits in Europe over the next 12 months.’ These are companies you may own shares in, going bust…
Morgan Stanley is predicting the biggest shock to US unemployment in history when the unemployment rate data comes out. It’ll spike to levels not seen since comparable records began in the ‘40s. Good luck suspending all those mortgages. Anyone remember sub-prime?
While the rest of the world is worried about Deutsche Bank, Deutsche Bank is worried that the central bank reaction to COVID-19 will spark inflation. They see the supply shock combined with stimulus as more money chasing less stuff. And that means higher prices.
None of this is priced into the stock market yet. Buyers are brave. Those who do this instead are wise.
|
Until next time, |
 |
|
Nick Hubble, PS: How Exposed Are You to an Aussie Recession?…and three steps to ‘recession-proofing’ your wealth. Download your free report now. |