
Myer Holdings Ltd [ASX:MYR] shares tanked 12% (at time of writing) after releasing mixed H1 results. Let’s take a quick look at why.
It seems investors were left unimpressed with Myer’s H1 results even though statutory net profit after tax was up 76.3% to $43 million.
Let’s examine the reasons for the MYR share price drop.
Myer’s shares were locked in a long-term slide and the COVID-19 disruptions only exacerbated the company’s challenges.
The company’s share price is on a downward trend for the last five years and has not offered a dividend since 2017.
However, Myer’s shares did rebound from the March low, pushing up over 200% after trading as low as 9 cents in March.
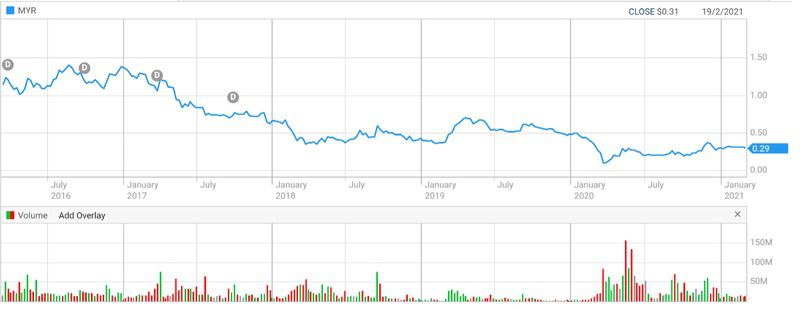
Source: tradingview.com
Let’s have a look at Myer’s 1H21 results.
Myer’s 1H21 performance
You can see Myer’s 1H21 results for the 26 weeks to 23 January 2021 compared to 1H20 below:
- Total sales down 13.1% to $1.398 billion
- Comparable store sales down 3.1% but up 6.3% if one excludes Myer’s six CBD stores
- Group online sales up 71% to $287.6 million, representing 21% of total sales
- Statutory net profit after tax up 76.3% to $43 million
- Operating Gross Profit (OGP) margin declined by 55 basis points to 38.6% in part due to lower margins in apparel categories
- Cost of Doing Business (CODB) down a substantial 20.9% ($86 million) to $325.2 million
- EBITDA declined by 1.7% to $214.6 million
- EBIT, however, was up 2.7% to $109 million with the EBIT margin increasing to 7.8%
- Net cash improved by $98.2 million to $201.1 million with inventory down 22%
- Dividend remains suspended
What are some of the key takeaways?
Although the company attributed the drop in total sales to ‘store closures and reduced foot traffic’, it must be noted that its full-year revenues have been shrinking since 2017.
Nonetheless, an important result was the strong growth in online sales.
The growth was strong enough for Myer to comment that it is ‘one of the largest and fastest growing online retailers in Australia.’
However, while online sales were strong and CODB was down 20.9%, Operating Gross Profit was still down a significant 14.3%.
Additionally, while CODB was down significantly, it was boosted by JobKeeper wage subsidies and rent waivers.
As brokers like Bell Potter suggested, Myer is likely to struggle reducing CODB further when wage and rent subsidies ease.
MYR share price outlook
Although COVID-19 lockdowns, restrictions, and general disruptions contributed to the mixed performance, Myer’s struggles predate the pandemic.
To attribute its losses wholly to COVID-19 would underestimate the challenges Myer and its retail rivals have faced for the last few years.
As the Australian Financial Review recently reported, even before COVID-19 struck Australia saw a long list of retailers going under such as PAS Group, Jeanswest, Topshop, Roger David, Bardot, and Harris Scarfe.
PAS Group chief executive Eric Morris admitted that ‘the Australian retail sector was already facing significant challenges prior to the COVID-19 pandemic.’
That said, other retailers thrived during the pandemic.
Kogan, as we’ve previously covered, saw its share price soar in 2020 and it is up over 200% in the last 12 months.
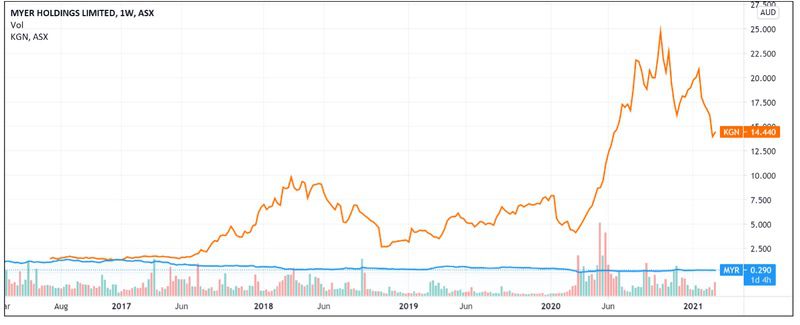
Source: Tradingview.com
As I previously said here on Money Morning, the ‘Myer/Kogan comparison shows you the rapid evolution in shopping habits in the pandemic age.’
Additionally, ‘Kogan doesn’t need to negotiate with landlords, because it is a budding e-commerce behemoth.’
And while Kogan avoids tetchy landlord issues, Myer must confront the fact that its premium CBD locations are suffering most from COVID-19-induced density restrictions as offices are yet to return to 100% capacity.
Indeed, in today’s ASX announcement Myer admitted that its ‘CBD stores [were] most impacted by reduced footfall’ so much so that comparable store sales in CBD stores were down 32%.
The sustained slide of Myer’s shares is neither recent nor unknown. So, are there any positives from this report that can spark investors’ interest?
The company’s online sales comprised 21% of its sales mix in 1H21, up a hefty 100% YoY.
The growth of Myer’s online sales and their contribution to its sales mix may well be what investors watch closely when pondering the attractiveness of owning Myer shares.
Myer’s efforts to improve its online services and its recent refinanced bank facility could enable Myer to trade its way through these tough periods.
If you are planning on trading shares like MYR over the coming months, it’s important to wrap your head around risk.
As in, if you had bought the March low and didn’t set a stop-loss prior to today’s slump, you’d be potentially setting yourself up for failure.
Learn how our chart guru Murray Dawes manages risk in this free guide to technical analysis.
If you’ve ever wondered how to effectively read a chart, this is the place to start.
Regards,
Lachlann Tierney,
For Money Morning

Comments