
‘The truth is not always beautiful, nor beautiful words the truth.’
Laozi, ancient philosopher
In a plot twist worthy of The Three Stooges, these same clueless clowns have now done a complete 180 on policy — raising rates aggressively and reducing balance sheets — to fight the very thing their asset pumping policies played a major role in causing…inflation.
Cash and (to a lesser degree) precious metals were the unloved assets in the everything bubble.
It’s a different story in 2022.
With shares, property, bonds, and cryptos all posting double-digit negative returns, cash and precious metals have fared better.
As stated in Part One of this series on The Truth:
‘Cash is King for now, however, even I acknowledge it’s not a long-term wealth creation solution.
‘Gold and silver are both struggling to get off the mat at present, but what about longer term?
‘Should you include gold and/or silver in your portfolio?
‘The September 2022 issue of The Gowdie Letter went in search of the truth on the role precious metals may or may not play in a portfolio.’
Gold buffs tell us many beautiful words about the alluring charm of this ancient store of wealth. But are they all true?
Is gold an inflation hedge?
If so, why hasn’t gold soared during this recent bout of high inflation?
Is gold a defence against money creation?
Are the Dow/Gold and Gold/Silver ratios reliable guide to value?
These and other questions were the subject of the September 2022 issue of The Gowdie Letter.
Our search for the truth on precious metals and the role they may or may not play in portfolios revealed some interesting data.
In Part Two of this series, we looked at the Dow-to-Gold ratio.
Today, we share with you what we found on the Gold-to-Silver ratio:
‘If we’re looking at the Gold-to-Silver ratio as a guide to portfolio weightings, we need to also explore…
‘The pricing history of Silver
‘When it comes to silver, there’s a similar pattern [to gold] in its price history…almost flatlining until the mid-1970s:
|
|
| Source: Macrotrends |
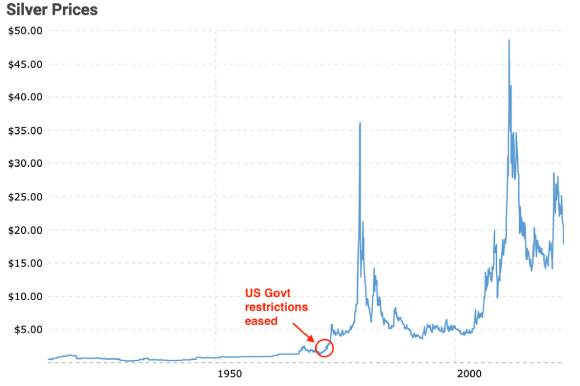
‘FirstGold provide an excellent overview on what influenced the silver price pre-20th century and during the 20th century.
‘If you’re interested in the history of the silver price (and how the US Government kept its heavy hand on this market as well), please go here.
‘In an effort to understand where true value may lie between gold and silver, the period I’m interested in is AFTER the US Government stepped away from its role as price maker/manipulator.
‘That’s when the silver price went parabolic…from US$5 to (at its daily peak) around US$50. Then plunged back to US$10.
‘I’ll let FirstGold tell the story (emphasis added):
“The Wild Ride of 1979-1980
“Silver Price History: US $5.40 – $49.45 – $10.80↓ per ounce
“Now a part of investment folklore, 1979 saw a meteoric rise in the silver price almost solely due to a single private source. Seeing that owning silver was a safe, smart and secure investment, some billionaires known as the Hunt Brothers formed a company along with two wealthy Arabian businessmen to, in effect, corner the silver market. By buying up silver in enormous quantities as a hedge against the rapidly weakening dollar, in a short period of time they owned almost half the world’s silver not held by governments.
“By driving the silver price up artificially, they created an economic situation that enraged financial industry insiders, large silver retailers, and the public.
“Iconic jewellery giant Tiffany’s took out a full page ad in The New York Times to demonstrate against the Hunt brothers and publicly decried their actions, stating ‘We think it is unconscionable for anyone to hoard several billion, yes billion, dollars worth of silver and thus drive the price up so high that others must pay artificially high prices for articles made of silver.’
“It was this crisis that caused the most infamous incident in silver price history. Known as Silver Thursday, a combination of bad debts, changed exchange rules, and panic on Wall Street in effect annihilated the Hunt Brothers’ monopoly over the silver supply and crashed silver market prices. It was a victory for those who supported a free and fair marketplace.”
‘In tandem with silver, gold also went on a meteoric price rise in the late 1970s/early 1980s.
‘For me, this period immediately after the US Government exited its price-maker role in the precious metals market, was akin to the old end-of-season “Mad Mondays” for football teams.
‘After decades of restraint, market participants cut loose.
‘Personally, I find it difficult to use any ratios from around this time as a reliable guide to where future value may lie.
‘Can those crazy animal spirits be recreated? Possibly.
‘If they are, then for investors in precious metals, it would be a pleasant surprise…but one you’d have to capitalise on BEFORE the “drunken footy players” came to their senses.
‘A nice problem to have, however, for the purpose of this exercise, we’ll ignore this potential “let’s go on a drunken-rampage” upside kicker.
‘In my opinion, a more informative value reading on the Gold-to-Silver ratio can be narrowed down to…
‘1980s onwards
‘Gold, we are told, is an inflation hedge and/or the only true store of wealth against the never-ending creation of fiat money.
‘Is it true?
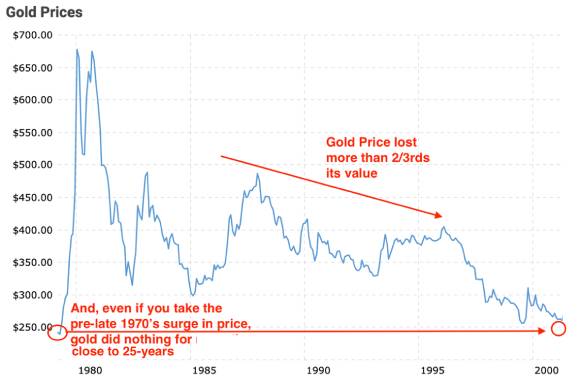
‘As shown above, from 1980–2000…the annual US inflation rate ticked along in the 2–5% range.
‘Yet, the gold price lost two-thirds of its value AND, even if we go back before the late 1970s gold price surge, we see the gold price did nothing for almost 25 years:
|
|
| Source: Macrotrends |
‘While inflation was ticking along at an annual 2%-plus per annum, the Fed kept the printing presses humming…M2 Money Supply increased threefold:
|
|
| Source: Federal Reserve Economic Data |
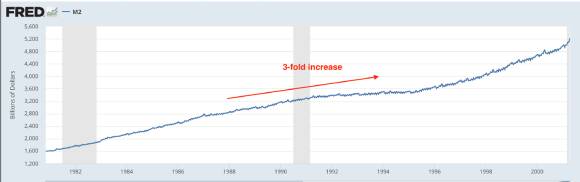
‘Trebling the quantity of fiat money in the US system did nothing to stop gold’s fall from grace.
‘Therefore, looking at this 20-year period in isolation, gold failed spectacularly in its role as the ultimate store of wealth.
‘Now, let’s look at the last 22 years.
‘2000 to now…
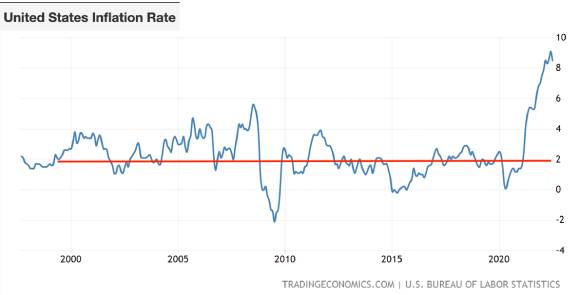
‘With the exception of the last year, US inflation has been playing “unders and overs” around the 2% per annum level…which is lower, on average, to the 1980–2000 period.
|
|
| Source: Trading Economics |
‘With the booster from the COVID stimulus print-a-thon, fiat money increased fivefold between 2000 and 2022:
|
|
| Source: Federal Reserve Economic Data |
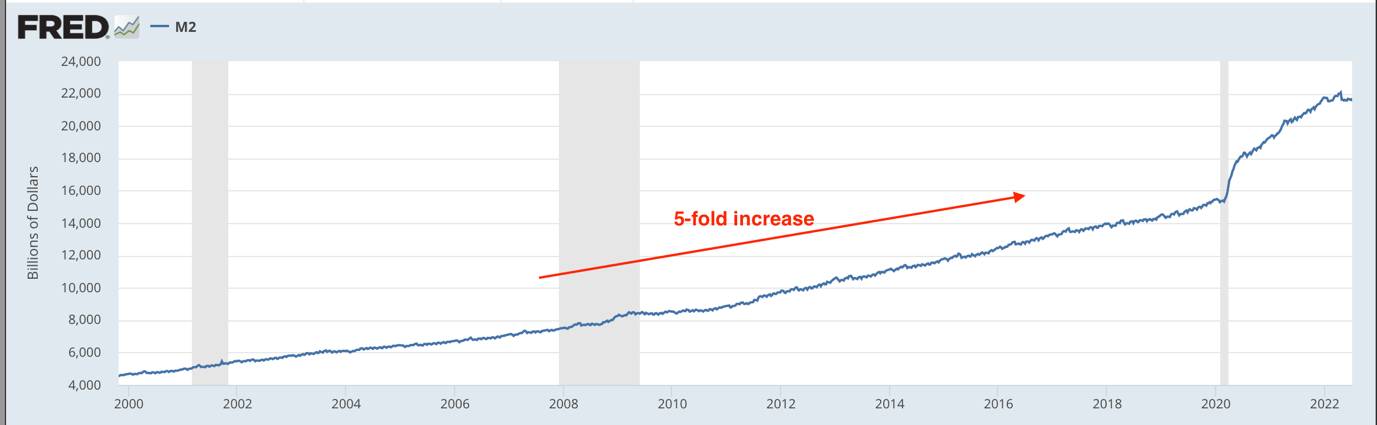
‘Over this period, when inflation has been lower and money supply greater, the gold price has increased almost sixfold:
|
|
| Source: Macrotrends |

‘Taken in isolation, you could conclude from this period that gold is the one true defender of value…fighting the fight against inflation and the reckless creation of paper money.
‘If we put the two periods together, what can we learn and possibly apply to the future?
‘Gold-to-Silver ratio
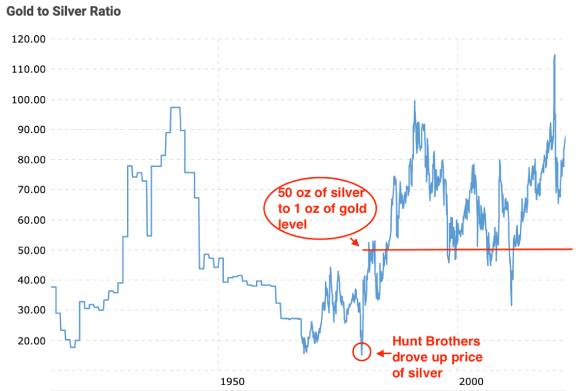
‘Provident Metals provides a little historical context on the Gold-to-Silver ratio (how many ounces of silver is required to buy one ounce of gold):
“Since 1687 — as far back as the records reach — the gold-to-silver ratio vacillated between roughly 14 and 100.
“Around 1900, the ratio steadied, remaining relatively flat.
“Indeed, prior to 1900, the gold-to-silver ratio hovered around 16.
“This was likely because many countries were using gold- and silver-backed currencies. For instance, France and the United States (among others) assigned statutory limits on what the ratio could be.
“Also, the U.S. Geological Survey estimates that there’s 17.5 times more silver in the Earth’s crust than gold, which could provide another explanation for the pre-1900 gold-to-silver ratio average.
“Throughout the twentieth century though, the gold-to-silver ratio has averaged about 47-50 and has fluctuated wildly at times.”
‘The period when the ratio fluctuated the wildest was the early 1980s…when the Hunt Brothers attempted to corner the silver market.
‘For round numbers, the prices back then, were:
|
|

‘After this brief episode of extraordinary market price manipulation, the ratio moved back to its 47–50 oz average…and, at times, well beyond:
|
|
| Source: Macrotrends |
‘The current ratio [as at September 2022] is:
|
|

‘If we look at the Gold-to-Silver ratio AFTER the two previous bubbles busted, the ratio returned to the 50oz level and below.’
As at close of trade last night (7 November 2022), the Gold-to-Silver ratio is:
|
|

Is the ratio slowly reverting to its long average…50 oz of silver to 1 oz of gold?
If so, then silver might be the preferred precious metal exposure for portfolios.
Next week, we’ll let you in on what we decided.
Regards,
 |
Vern Gowdie,
Editor, The Daily Reckoning Australia

Comments