
Dear Reader,
In the wake of COVID-19, there’s been much talk about a V-shaped recovery — a sharp fall in economic activity followed by a dramatic rise.
But as Jim Rickards explains below, this is just happy talk (and therefore not helpful for anyone). So, what is the likely shape of the recovery? Keep reading to find out…
| Until next time, |
| Shae Russell, |
The happy talk about a V-shaped recovery in China (and, by extension, the rest of the world) was exaggerated and at best premature.
The following chart shows five components of Chinese total output: Construction starts, property sales, retail sales, fixed asset investment, and industrial value-added.
|
|
| Source: Market Watch |
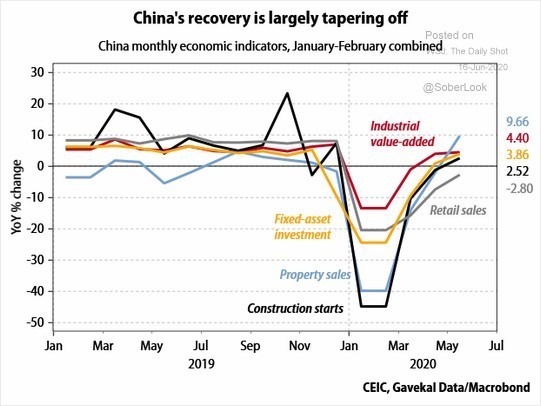
As would be expected, all these indicators dropped sharply during the early stage of the Chinese lockdown, continued along the bottom for a while, and then rebounded as the economy reopened. It looks like a healthy recovery. But the chart reveals serious cause for concern about the sustainability of the recovery.
The first factor to bear in mind is that the chart is expressed as a year-over-year percentage change. Getting back to zero does not mean you’ve recovered the lost output. It just means your total output is back where you were a year ago after the prior month in which you lost 40% of what you produced the year before. To recover lost output, China must outperform the prior year’s output and it’s not even close to that.
The other troubling sign is that, after the steep recovery, these indicators are already starting to flatten out. Which means they won’t make up for lost output and may even not be able to outperform 2019 levels for the remainder of this year.
It appears likely that China, like many other countries, will not surpass 2019 output levels until 2022 or later.
[conversion type=”in_post”]
I need a dollar; a dollar is what I need
The following chart is a warning sign of financial distress yet to come. This chart shows the dollar value of dollar-denominated bonds issued on international markets by Chinese borrowers from 2005 to 2020. Obviously, issuance accelerates from a modest increase from 2005–2010 to an exponential increase from 2010–2020.
|
|
| Source: Market Watch |
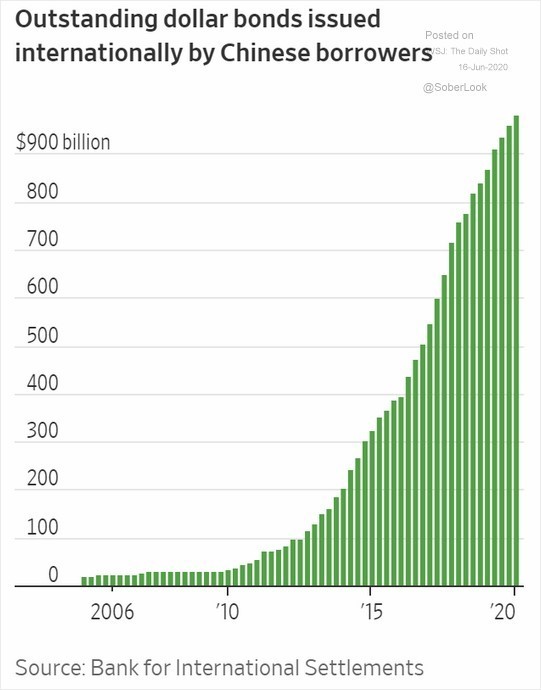
The point is that the Chinese central bank does not print dollars. It has approximately US$3 trillion in dollar reserves, but about US$2 trillion of those reserves are either held on a precautionary basis to bail out Chinese banks (about US$1 trillion) or are in illiquid assets such as hedge funds and private equity (about US$1 trillion). This means the central bank has only US$1 trillion in reserves to defend the currency, pay for needed imports or, if necessary, bail out these corporate debtors who borrowed in US dollars.
The dollar debtors are supposed to pay off or roll over this dollar debt by earning dollars through exports or with new dollars raised from direct foreign investment. However, Chinese exports are suffering because of the global depression, and new direct foreign investment is being impeded because of deteriorating relations between the US and China.
The chart above may be a preview of a dollar-debt default wave heading towards global capital markets later this year or in early 2021.
With that overview of the global economic outlook as a backdrop, let’s take a closer look at the prospects for a recovery. I’m going to focus on the US economic situation, because it’s the largest economy. In particular, we’ll look at the likely shape of the recovery, and a key factor that will contribute to lower growth.
The likely shape of the recovery
Analysts and talking heads debate the recovery’s strength using letters that mimic the shape of a growth curve as shown on a graph.
A V-shaped recovery goes down steeply and back up steeply to get output back where it started in a relatively brief time. A U-shaped recovery goes down steeply, does not grow materially right away and then makes a sharp recovery.
An L-shaped recovery goes down steeply, followed by low growth for an indefinite period. Finally, the W-shaped recovery goes down steeply, bounces back quickly, then falters for a second time before finally recovering and getting back to earlier levels of output and growth.
So, which shape will we see? Well, is 10% growth even a possibility? History says no. In fact, we haven’t even recovered from 2008 yet.
Post-1980 recoveries averaged 3.2% growth. The post-2009 recovery produced only 2.2% growth. It was an L-shaped recovery. It was a real recovery, yet the output gap between the former trend and the new trend was never closed.
The US economy suffered over US$4 trillion of lost wealth based on the difference between the former strong trend and the new weaker trend. That lost wealth was a serious problem for the US in terms of income inequality and the national debt-to-GDP ratio before the New Great Depression. Now, the prospect is for even lower growth than the weak post-2009 recovery.
The new recovery may only produce 1.8% growth — even worse than the 2.2% growth before the pandemic. It’s another L-shaped recovery; the second in a row. Now the bottom of the L is even closer to a flatline, and the output gap compared to the long-term trend is even greater.
Why a high savings rate will contribute to lower growth
Some causes of this weak growth include a second wave of layoffs, government incentives to delay a return to work, bankruptcies, a collapse of world trade, a growing work-from-home business model, declining labour force participation, and recursive functions whereby weakness begets weakness in upstream supply chains.
Still, there’s another factor that may dominate these trends and ensure low growth. That factor is high savings.
A high savings rate sounds like a desirable outcome. In the long run, it is. Savings can translate into investment, which is the source of jobs and higher productivity, which lead to economic growth.
This assumes the investment is not wasted, as it is in China. The US has ample high-productivity investment opportunities in infrastructure, education, and research, so the prospects are good that US investment can be a key to growth.
The problem is that investment has long-term payoffs and it comes at the expense of short-term consumption. The US economy is driven 70% by consumption. There’s no way to increase investment (for the long run) without killing consumption (in the short run) unless the US runs higher deficits and borrows more from abroad. Still, US deficits are already at record levels, and foreign nations have their own economic collapses and public deficits to deal with.
Savers have already voted, with their feet
Trade-offs between savings and consumption are academic because Americans have already voted with their feet. In May 2020, US savings as a percentage of disposable income skyrocketed from 7.5% to 33%.
Americans are saving, not spending. This makes sense if you are unemployed and worried about making the next car payment or rent payment. It also makes sense if you are not unemployed yet worry you might be next to get laid off.
Even if your job and income were secure, you might save more because of the prospect of deflation. In deflation, cash can be your best performing asset because the real value of cash goes up as the cost of living goes down.
All these elements — more layoffs, more bankruptcies, feedback loops, and a spending strike in the form of higher savings — mean the recovery will be slow and unemployment will stay high.
There will be no V-shaped recovery. There are no green shoots despite what you hear on TV. We are in a new Great Depression and will remain so for years.
| All the best, |
 |
| Jim Rickards, |

Comments