
In today’s Money Weekend…It’s a sea of bad news out there at the moment…Nasdaq selling has just begun…and much more…
It’s a sea of bad news out there at the moment. Equities have cracked and they are continuing to drift lower.
The buy the dip crowd have already had a few goes at buying sell-offs and they are starting to get gun shy.
The trend is down and there’s no reason to change that view until you see concrete signs of momentum turning back up.
Now that major support levels have been broken, volatility is much higher than normal. Therefore, many traders get sucked into bad positions at exactly the wrong moment. In a bear market, both the bulls and the bears can end up losing money due to the sharp moves in either direction that usually occur.
Imagine you are stretching a rubber band as far as it can go. What can happen from there? Either the rubber band is going to break or it will snap back sharply once you let it go.
That’s where we are now in the markets. Either the rubber band is going to break and markets will enter a freefall situation for a few weeks, or we are close to a sharp short squeeze that will see mean reversion to the long-term moving averages.
If we do see a short squeeze from here, I don’t think it is the end of the sell-off, although it could see markets settle down for a few weeks or even a few months.
There are a few signs that inflation may be close to peaking. Growth is certainly coming off the boil at a rapid rate. US 10-year bond yields have fallen back below the decade-high level of 3.25% that I have been talking about.
If that is the peak in 10-year bonds yields for now, we may see stocks catch a bid.
But in situations like this, when markets have had a sharp adjustment, you are waiting for the really bad news to start flowing. Is there a debt crisis brewing in emerging markets as rates and the US dollar rise?
Will the Japanese yen keep imploding to a point that it creates a crisis in Japan?
Are there large businesses that have taken losses as a result of the sharp jump in rates?
Who knows? With markets teetering on the edge of a crash-like situation, any seriously bad news that comes out over the next few weeks or months could ignite a period of panicked selling.
So, if you are searching for bargains now that tax-loss selling is done and dusted, just keep your wits about you and have a concrete plan to run away from positions quickly if all hell breaks loose.
Nasdaq selling has just begun
|
|
| Source: Tradingview.com |
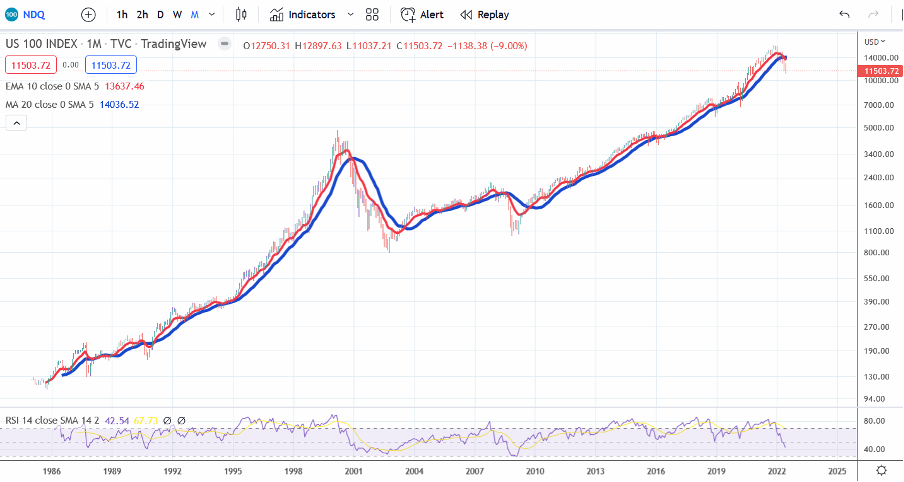
I sent this chart around to all the traders at Fat Tail Investment Research during the week. It is the Nasdaq since 1985 using a logarithmic scale.
This type of scale is useful when looking at data over long periods of time because it clearly shows percentage moves rather than nominal changes in the price. What I mean by that is that the Y-scale is adjusted for percentage moves, so a 100% jump in the price will cover as much distance on the chart wherever it occurs.
The first thing to note is that the long-term trend based on my moving averages (10-period exponential and 20-period simple moving average) has just turned down for the first time since the 2008 crash.
The other thing to note is that the logarithmic scale shows you that the selling we have seen so far is not that much compared to past large corrections. The 2000–03 crash and the 2008 crash saw much steeper declines after the long-term trend turned down.
So, we may still be in the early stages of this sell-off.
Check out my ‘Closing Bell’ video above where I show you the moves that have been happening across major sectors of the US markets and commodities.
Regards,
 |
Murray Dawes,
Editor, Money Weekend
