
Three things you need to know today…
1) Should you worry about a market crash?
US shares are getting hammered currently. It’s dragging down our market too.
The Aussie market is down around 7% since the middle of February. Perhaps the most notable stock to finally roll over is Commonwealth Bank [ASX:CBA].
Did we just see the all-time high set (at $165 per share) for a long, long time? Maybe.
That said, for me, volatility like now is an opportunity to accumulate shares in companies you might like to own long term. See below for more on this strategy.
The perennial fear is a stock market crash. But I don’t see much evidence for that kind of outcome, absent a wildcard.
I told you the other week that American earnings are at all-time highs. That’s a strong base for the US market.
What about things here in Australia?
Two recent data points put my mind at ease. NSW land values hit an all-time high recently.
And the rest of the country’s real estate markets are looking prospective for further growth as we enter a rate-cutting cycle.
This all supportive of the biggest asset class in the country: property!
What else?
Right now, we have lavish government spending.
See for yourself here…
‘Prime Minister Anthony Albanese has overseen the biggest spending increase as a share of the economy for a first-term government since Gough Whitlam in the 1970s.’
I don’t know of any case in history (besides the Covid-19 panic for shares) when asset markets collapsed with rising government spending and falling interest rates going on at the same time.
That’s the state of play right now. That doesn’t mean the Aussie market will bounce tomorrow. We might stay under pressure for a while yet.
But I still expect the share market to push higher over the next several years.
Just on that…
2) When volatility equals opportunity…
Volatility is moving up. One way to measure this is the ‘VIX’ index. It’s a measure derived from the risk premiums in the options market.
You can see it rising here over the last month…
| |
| Source: Yahoo! Finance |
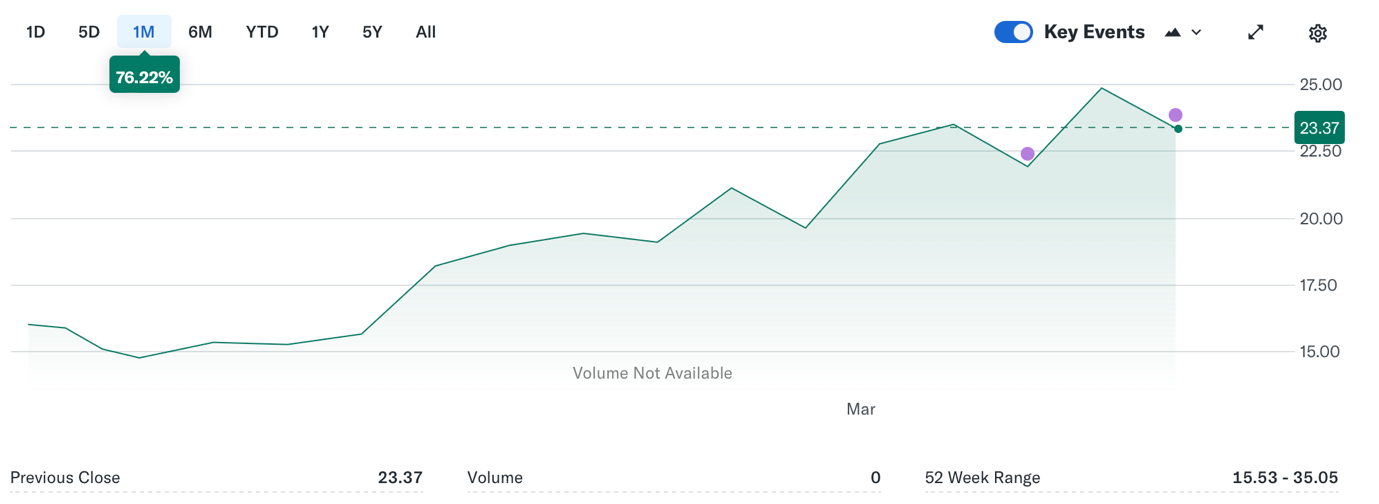
The higher it goes; the more market participants are paying to protect themselves.
We have some recent research on this that makes for interesting reading.
Analysts at research firm Porter & Co report that the US markets have seen the VIX rise above 30 many times over the years, including 1997, 1998, 2001, 2002, 2008, 2011, 2015, 2018, 2020, and 2022.
These years might not mean much if you don’t follow market history, but they include:
- The Asian Financial Crisis
- Dot com crash
- Global Financial Crisis
- Eurozone Crisis
- Covid Collapse
In other words, some of the most intimidating periods in history.
Here’s what P&C found if you’d invested $10,000 in the S&P500 the day after the VIX hit 30 in each of these years…
| |
| Source: Porter & Co |
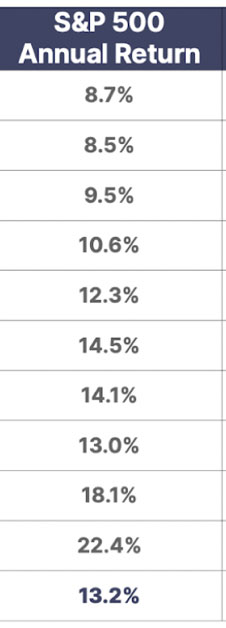
What this is suggesting is that you could literally do little to nothing every three years or so but wait for a volatility spike and buy into the panic to lower your entry price.
The VIX closed overnight at 27.9.
Stay tuned. We might get to 30 yet. But remember, there are no guarantees of a repeat performance either.
3) The Australian Financial Review reports on a fund manager smashing the lights out lately…
His returns over the last few years?
22.7% for FY23, 35.9% for FY24 and 37.7% so far in FY25.
Where are these barnstorming results coming from?
You probably guessed: the gold sector. It’s been smashing the lights out lately.
The AFR reports…
‘[He] is most bullish on mid-cap miners who produce less than 1 million ounces a year. Nearly half the fund is invested in that space because it often flies under the radar of analysts, despite generating significant cash flow.’
Indeed. My colleague, gold specialist Brian Chu, has been making the case for gold stocks for some time.
You can see from the above to see why. And while investing in gold stocks is risky, it’s amazing to think there could still be so much opportunity in this sector…but I back them both up, all the way.
You can get Brian’s latest analysis here.
Best wishes,
 |
Callum Newman,
Editor, Small-Cap Systems and Australian Small-Cap Investigator
***
Murray’s Chart of the Day
— Brent Crude Oil
| |
| Source: Tradingview.com |
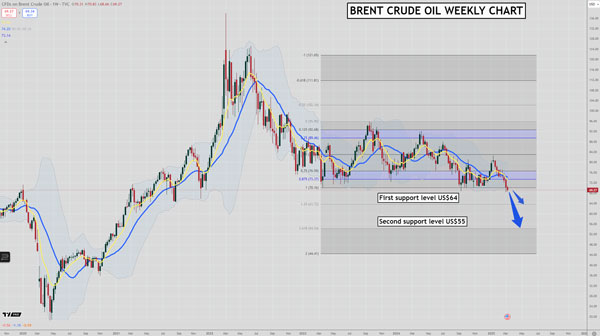
Oil price collapse
I have been warning you that the oil price looked bearish since January when Brent Crude Oil was 10% above current levels.
My view has been that the price could sell off sharply if major support at US$69 doesn’t hold.
Brent Crude Oil hit $69 last week and is currently holding at that level. It won’t take much more selling for major stop losses to be set off that could force the price down sharply.
There are two major support levels below $69 that I think could get hit over the next few months.
US$64 is the first level of support and then US$55 below that.
Trump’s drill baby drill, a better relationship with Russia, and a softening in growth expectations could be enough to set off the chain reaction to the downside.
Regards,
 |
Murray Dawes,
Editor, Retirement Trader and Fat Tail Microcaps

Comments