
In today’s Money Weekend…what does up mean?…buy and sell pivots…finding and edge…and much more…
What does up mean?
In today’s essay I want to tell you about buy and sell pivots. The name of my trading service is Retirement Trader, so I guess you could say they’re rather fundamental in my approach to trading.
When you understand not only what they are but how you can use them to signal entries and profit taking levels in trades, I hope you will start to see their power.
I am going to repeat a section of an article I wrote last year that explains what they are because there’s no need to reinvent the wheel and then below that section I will elaborate.
I want to make sure that this series of ‘Traders Corner’ articles contains everything that you need to know to comprehend the way I analyse markets. Then interested people can read all of the articles in order to get a crash course in how I make money for members of Retirement Trader.
‘Price action is so complex that the very idea of ‘up’ and ‘down’ is difficult to define.
‘For example, with the price of some stock bid at say, $10.00 and offered at $10.01, would you define each time it trades at either price ‘going up’ or ‘going down’? If that is too granular for you what should the definition be?
‘Many would point to moving averages as a useful tool to define such things, but in my experience moving averages aren’t as good as they look at first sight. There are far too many false signals at shorter time frames and prices move so fast that you end up acting far too late if your moving average is set at a point where it filters out a lot of false signals.
‘Lagging indicators are just that, lagging. If prices are trending strongly for long periods of time it can appear as if moving averages are the easy path to riches. But once prices enter a consolidation phase you soon find out that moving averages can cause a lot of losses very quickly.
‘If you have a huge amount of money, there is a case that you can put up with plenty of losses during consolidation periods because you make so much during the trends. But let’s face it, most of us aren’t made of money and the prospect of taking loss after loss for months will quickly wear thin. It’s not the way I want to trade.
‘So we need a definition that isn’t lagging, but is repeatable and defines a change in market direction quickly.
‘Buy and sell pivots
‘The definition I have settled on to work out when a market is potentially changing direction is the buy and sell pivot. I will define it for you below.
‘The reason I use the buy and sell pivot to help me with entry signals is because markets quite literally can’t change direction in whatever time frame I am using without one being present.
‘For example, if prices are going down day after day with lower highs and lower lows, how could prices turn back up without closing above the high of the day with the lowest price in the whole move?
‘The picture below shows you green bars which represent prices closing on the high of the days range. The red bars represent prices closing on the low of the day.
‘Simplified example of buy and sell pivots
|
|
| Source: Port Phillip Publishing |
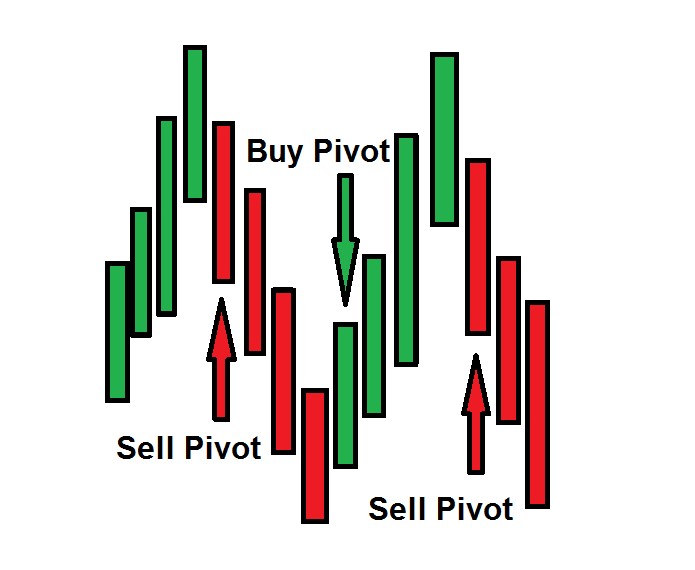
‘Quite clearly the very first thing that must happen if prices are going to change direction is that a buy or sell pivot must be seen.
‘Unfortunately, that knowledge alone is worth nothing.’
If you look at a five-minute chart you will literally see buy and sell pivots all over the place. Many traders cotton on to buy and sell pivots but then end up deciding they are worthless because there’s no way you can make money buying and selling all of them.
The power of buy and sell pivots starts to reveal themselves at higher time frames but there still isn’t a trading system trying to buy and sell them all as soon as they are created.
[conversion type=”in_post”]
Finding an edge
The most important thing to understand about buy and sell pivots is that it’s where they occur that is most important.
If you can work out an area where markets often change direction and combine it with a clear definition of what a change of direction looks like you are getting closer to a viable strategy.
But even then there is more work to do.
The secret sauce of my system, which I of course can’t reveal, is the analysis of what happens after the buy or sell pivot is created. That’s where I find my exact entry points that give me solid risk/reward.
Remember, I have been teaching you all about widening distributions for the past few weeks. The reason why it is imperative to understand what they are and how they work is because they can give you the areas where we know there is a heightened probability that prices will change direction and head back to the point of control.
You now have an understanding of where prices change direction and how prices change direction.
We have been building up the pieces of the jigsaw and are getting closer to revealing deeper aspects of the theory that will require all of the past information that I have been giving you. So if you haven’t read all of the articles and would like to, you can find them here.
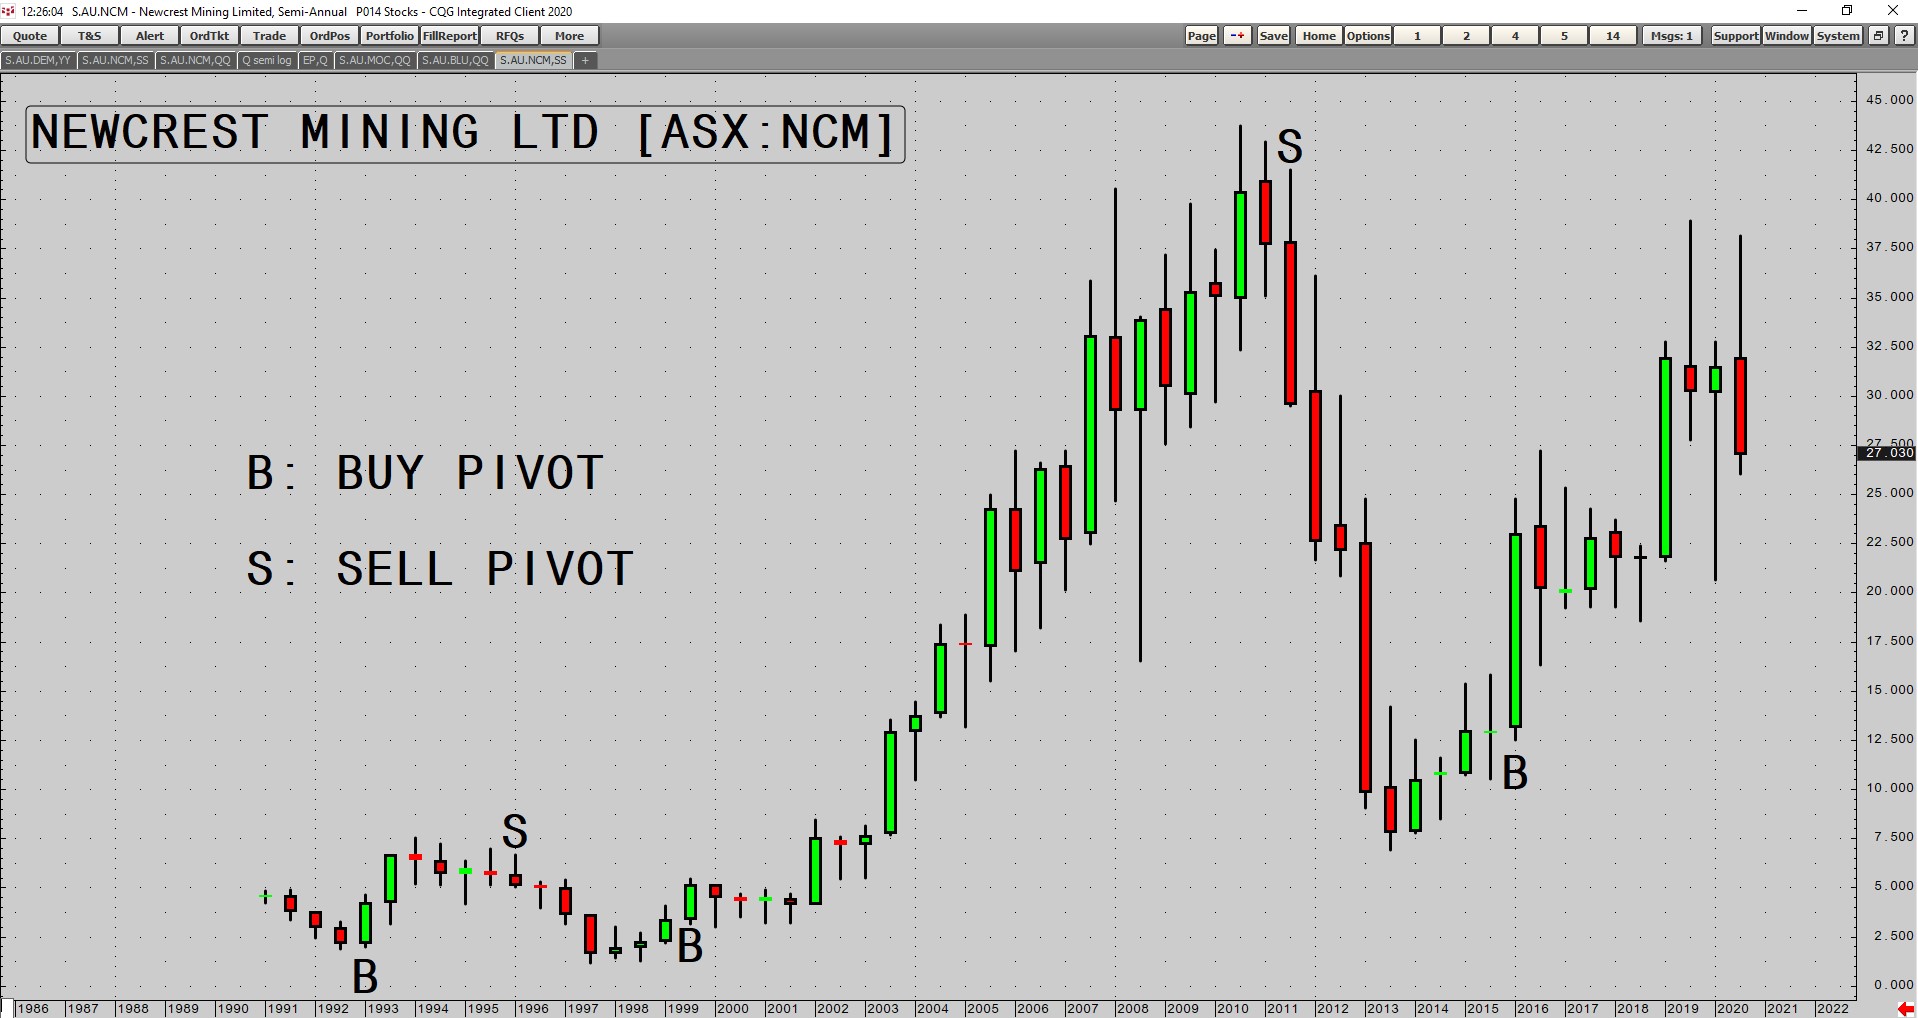
I will leave you with a chart showing 30 years of semi-annual data of Newcrest Mining Ltd [ASX:NCM] and you can have a think about whether you would have liked to know where the semi-annual buy and sell pivots were in NCM over that time.
More to pivots than meets the eye
|
|
| Source: CQG Integrated Client |
Regards,
 |
Murray Dawes,
For Money Weekend
PS: Make Profitable Trades, More Often — Trading expert Murray Dawes reveals his unique trading strategy designed to help you clock up steady gains in any market, while limiting your downside risks. Click here to learn more.

Comments