
In today’s Money Weekend…gold looking hot…real yields plunging…demand shock inflation…gold has further to run…and much more…
What a difference a week makes.
Last week, I placed my stake in the ground by calling for a sharp spike in the gold price. I gave you six gold stocks to consider in the Closing Bell video.
The call was for a US$100 spike in the gold price within a month, and the price is up US$65 in a week — from US$1,795 to US$1,860. Now that the price has broken through US$1,835, I am far more comfortable that the rally will have legs and continue to the upside for a while.
The huge CPI print in the US was the catalyst for the price breaking through resistance at US$1,835. The fact that news like that was behind the break increases my conviction that the correction in gold may be over.
Real yields plunging
I want to show you a few charts to give you a clearer understanding of the situation in US bonds, now that inflation is shooting through 6% annualised.
Negative real yield on corporate bonds
|
|
| Source: yardeni.com |
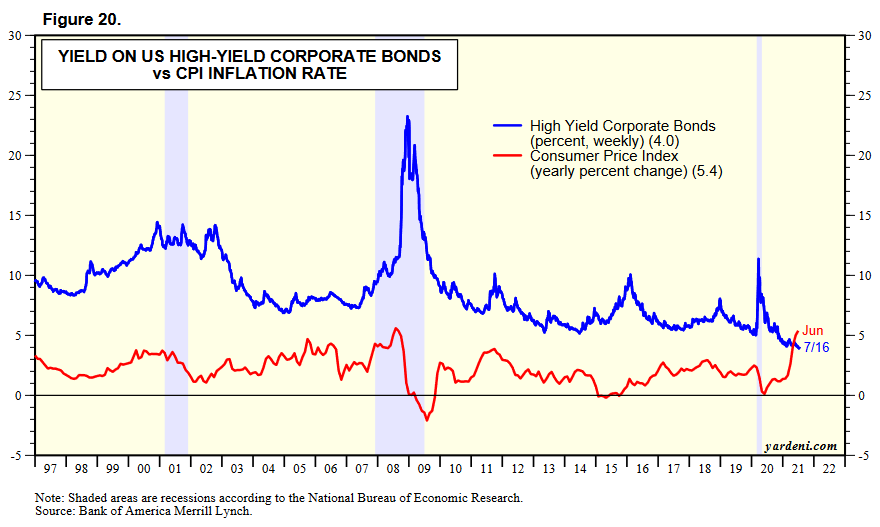
The first one shows you that the yield on high-yield corporate bonds has just gone negative compared to CPI. In a normal world, that should never happen.
Bond yields lagging inflation
|
|
| Source: yardeni.com |
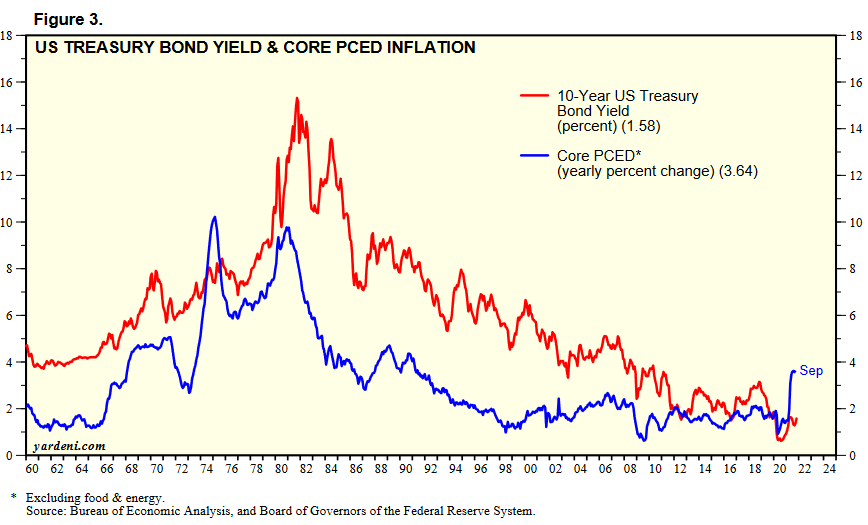
This one gives you 60 years of data to drive the point home that we are entering a new phase, with core PCED inflation shooting much higher than the 10-year bond yield.
How low can yields go?
|
|
| Source: yardeni.com |

This next one shows you how rapidly yields are plunging into negative territory and compares it to the last time inflation took off in the ’70s.
No one else wants them?
|
|
| Source: yardeni.com |
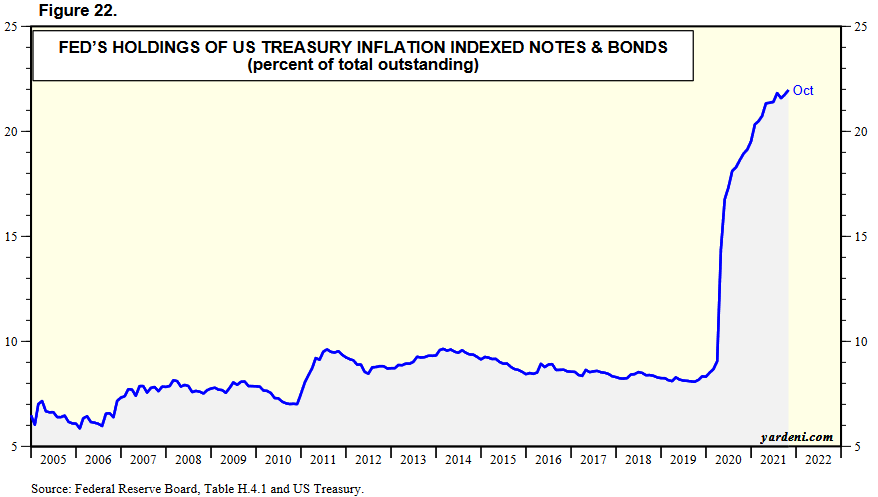
And then this final one shows you how immense the Feds intervention has been over the last couple of years. You reap what you sow.
Demand shock inflation
I read an amazing article during the week that I think is a must-read for anyone who is trying to get their head around what the current spike in inflation means.
It was written by Bridgewater Associates, and it contains many brilliant charts to make their point that what we are witnessing isn’t just a supply shock led inflation due to supply chain issues as we come out of the pandemic.
They believe it is an upward demand shock as a result of monetary policy.
I am inclined to agree with them. Supply has recovered well since the pandemic, but demand has exploded.
We have seen a sustained rally across the board in commodities, and that rally is occurring alongside an increase in supply.
House prices are going vertical due to extremely loose monetary policy, and that rising ‘wealth’ will leak out into demand for goods and services.
Rents are spiking, alongside house prices, as investors try to recoup their costs. The owner equivalent rent (OER) figure — which makes up a major part of US inflation figures — is lagging way behind real-time shifts in rents, so higher inflation via OER is cooked into the figures going forward.
Chinese PPI is still surprising to the upside, with an eye-popping figure of 13.5% annualised released during the week. That inflation will find it’s way into US CPI figures at some point and will also lead to margin contraction for businesses that try to absorb some of the cost increases.
We all know that central banks love lowering rates but have to be dragged kicking and screaming to raise rates. If they are lagging behind inflation, I don’t see much hope that they will change course fast enough to bring inflation back down rapidly.
There is so much debt in the system now and rates are so low that we may see the economy slow rapidly, with interest rates rising a percent or two. That seems to be the message being sent by the US yield curve flattening since taper was announced.
I won’t profess to know how things will play out going forward, but the fact is we are entering a new phase for the markets now that inflation rates are finally starting to break out.
Many think it’s just a case of post-pandemic supply bottlenecks and soon enough things will get back to normal, with inflation dropping back to negligible levels. But to hold that view you must put a lot of faith in central bankers who have been constantly pumping markets at every opportunity for decades.
There must be consequences for their actions, and perhaps what we are witnessing is the chickens finally coming home to roost.
Gold has further to run
With interest rates plunging further into negative territory by the day, the opportunity cost of holding gold continues to remain negligible.
Last week, I gave you this chart with my expectation of what I thought was coming.
Target hit
|
|
| Source: tradingview.com |
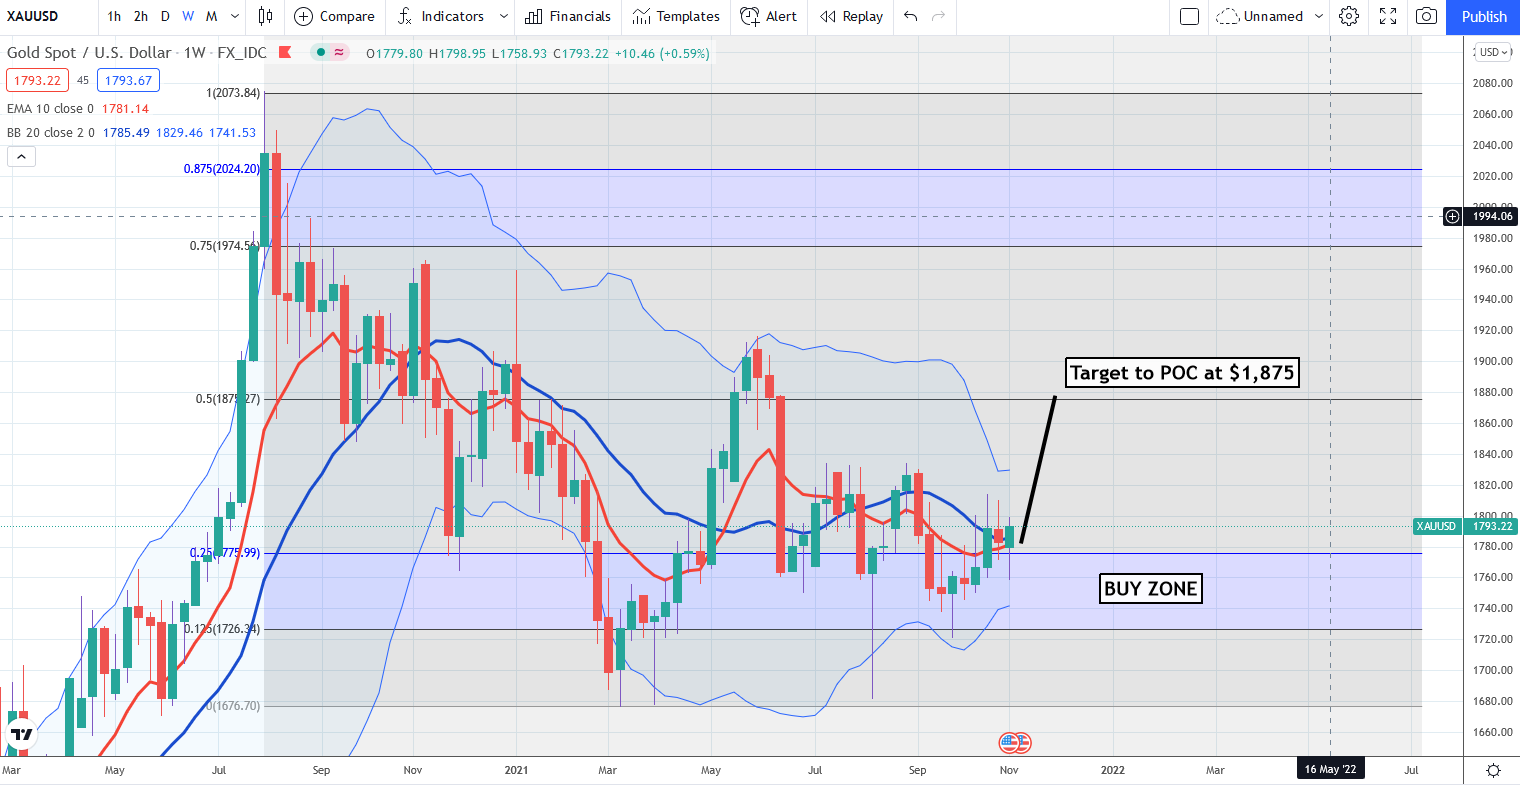
My target to the point of control (POC) at US$1,875 has almost been hit one week later, with a high price in the move of US$1,868.
If the POC doesn’t create much resistance, there is a chance the gold price could move quite rapidly to the sell zone of the range created during the correction. That is up at US$1,975 to US$2,025.
Gold stocks would get a rocket under them if that were to occur.
Check out my Closing Bell video below, where I update you on the gold stocks that I think should benefit in the rally.
Regards,
 |
Murray Dawes,
For Money Weekend
PS: Watch the latest episode of my series ‘The Closing Bell’ on YouTube. Click here or the thumbnail below to view it.

