In today’s Money Weekend…US 10-year yields still trending higher…profit-taking in stocks…advance/decline warning…and more…
The rise in US bond yields has fallen off the radar lately.
After hitting a high of 1.77% a month ago, US 10-year bond yields fell to 1.53% over the next couple of weeks.
That helped the Nasdaq to bounce back to all-time highs after tech stocks had taken fright at the prospect of rising long-term yields.
But the rise in yields isn’t over yet.
Over the last week, US 10-year bond yields jumped to a high of 1.68% and are currently trading at around 1.65%.
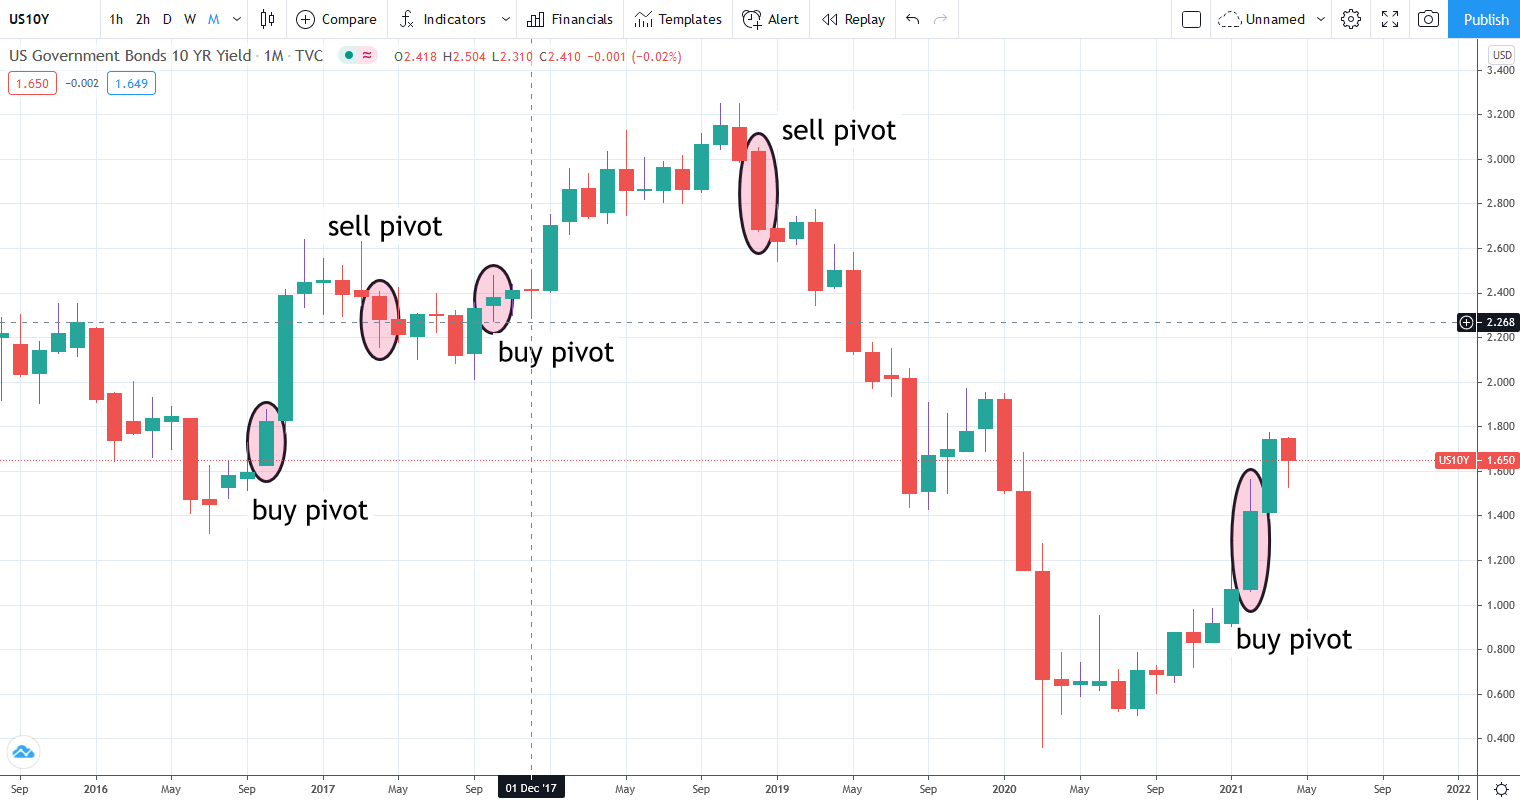
If we look at a monthly chart of US yields, it is pretty clear that it’s too early to say that the trend higher in yields is over.
US 10-year yields still trending higher
|
|
| Source: Tradingview.com |
The chart above goes back to 2016 and I have circled and named each buy and sell pivot that has happened in that time.
Remember that the chart is showing US yields rather than price. Yields move inversely to price, so when the yields are heading higher the price of the bonds is going down. A monthly buy pivot in the chart above equates to a monthly sell pivot in the price of the bonds.
Notice how useful it has been over the past few years to know what the most recent buy or sell pivot was?
It is far too simplistic to say that you could make money by blindly trading them when they occur. Markets are far too tricky to allow something so simple to work.
My point is just that the monthly buy pivot was recently confirmed a couple of months ago, so the monthly trend in US yields is up. Until we see a monthly sell pivot confirmed I consider the risk in yields is to the upside.
If you don’t know what the hell I’m talking about when I say, ‘buy pivot’, it is simply the candle that confirms a monthly close above the high of the candle with the lowest price in a downtrend.
The monthly sell pivot is confirmed when prices close below the low of the candle with the highest price in an uptrend.
It is impossible for a large trend to develop without first creating a buy or sell pivot. They are handy to keep an eye on.
When you look at the big picture like this, the recent fall in yields is just a blip and there are no concrete signs at all that the rise in yields is finished.
Stocks have been adjusting to the higher level in yields, but I reckon a spike towards 2% will cause another bout of selling in the tech sector especially.
Profit-taking in stocks
There has been plenty of profit-taking going on over the past few months in Aussie stocks despite the fact the index continues to trade higher on the back of the strong rally in financials and property stocks.
We are enduring incredibly difficult trading conditions at the moment because there is so little momentum in stocks outside the key sectors that are rallying.
The charts are still pointing up, and there’s no hint of coming trouble, but I’m growing warier by the day as I watch most stocks drift aimlessly.
A few of the recent market darlings have seen strong selling pressure.
Andromeda Metals Ltd [ASX:ADN] has dropped 50% from its recent high of 45 cents, to 23 cents.
Imagion Biosystems Ltd [ASX:IBX] surprised the market this week by saying they hadn’t signed up one person for the first in human trials after four months of trying. They had rallied from 1 cent to 20 cents in less than a year on hopes for their new scanning method for cancer but have been brutally sold off over the last few days to 9 cents.
In the interests of full disclosure, I hold some options in IBX.
Beach Energy Ltd [ASX:BPT] disappointed the market yesterday with a downgrade to earnings and 2P reserves. They are down over 20% at $1.33 with 68 million shares changing hands by 1pm, Friday, when I wrote this article.
Other energy stocks are struggling to rally despite the strong oil price, with Origin Energy Ltd [ASX:ORG] heading towards its lowest price in two decades after updating the market a few weeks ago. AGL Energy Ltd [ASX:AGL] is still in freefall, trading at all-time lows.
So, despite the fact the market is trading near all-time highs, there are signs beneath the surface that the heat is coming out of the speculative end and companies that disappoint are copping an absolute shellacking.
Advance/decline warning
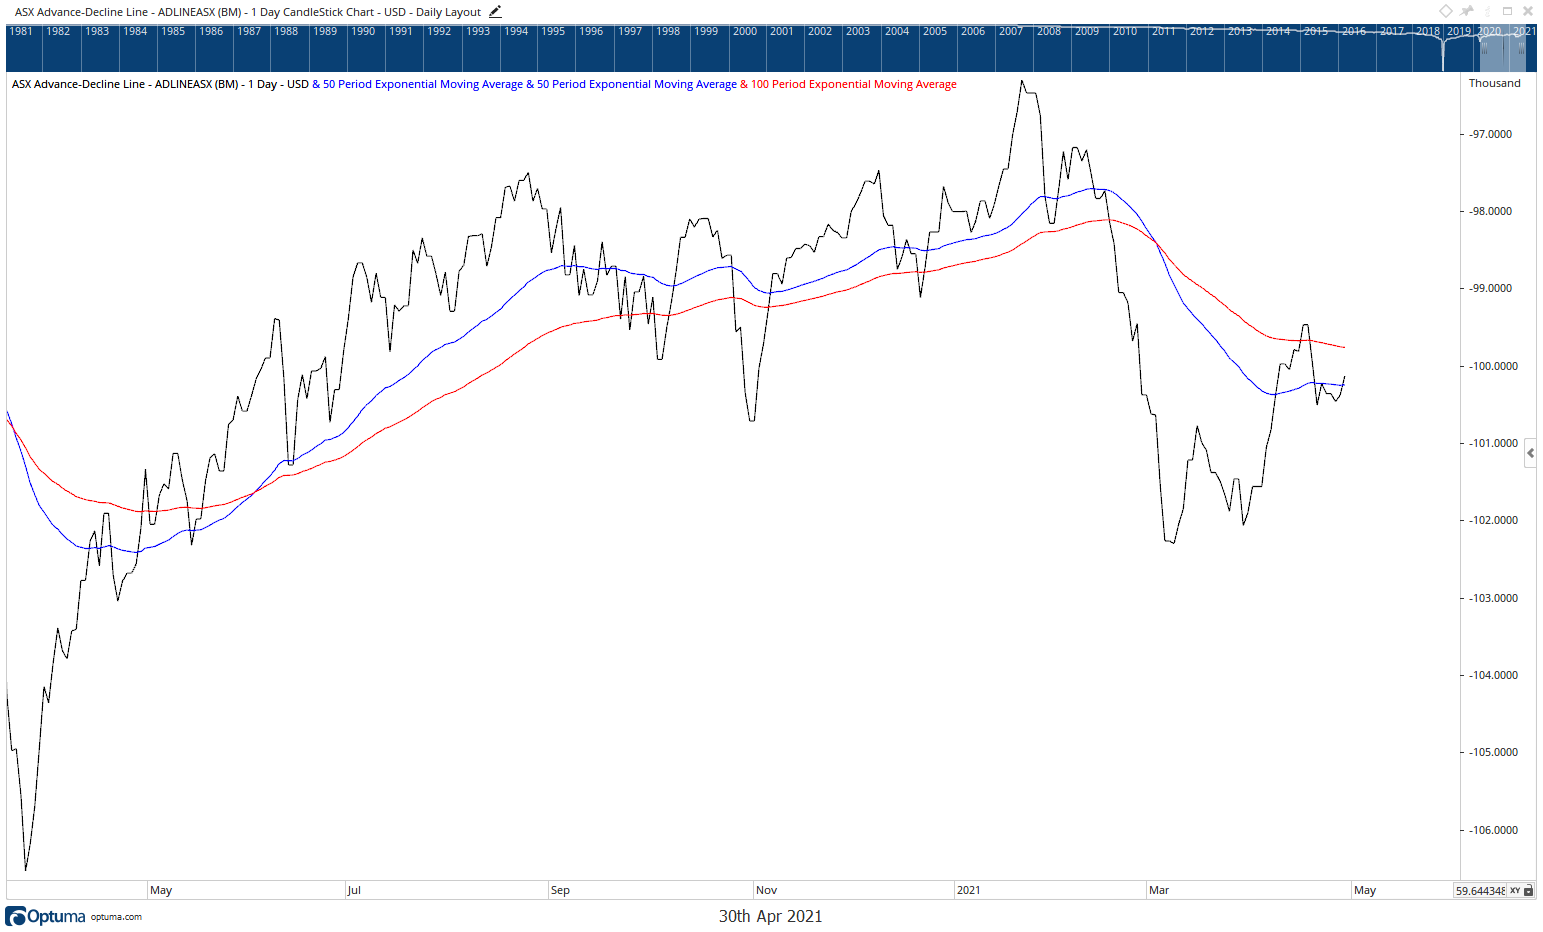
The advance/decline line in the ASX 200 has been trending down since March which is usually a fairly good warning sign that all is not well.
Advance/decline declining
|
|
| Source: Optuma.com |
We are heading into May and as I said last week, the old saying ‘sell in May and go away’ might just be on the money this year.
Regards,
 |
Murray Dawes,
For Money Weekend
PS: Promising Small-Cap Stocks: Market expert Ryan Clarkson-Ledward reveals why these four undervalued stocks could potentially soar in 2021. Click here to learn more.


Comments