
In today’s Money Weekend…the price of the stock contains a lot more information than you might think…widening distribution…the US election is only days away…and more…
Last week I told you to spend more time looking inside for the answers to the riddles of the markets.
Having a clearer picture of why you do what you do under pressure will add more value to your trading account than studying a company’s balance sheet.
But a Zen monk won’t be a great trader just because they understand themselves. There is a lot more to it than that.
The amount of information at your fingertips is pretty much limitless these days. You could read company reports 24/7 searching for the perfect stock to enter.
If you don’t have a clear picture in your mind of what types of information are useful and what needs to be ignored, you will end up thoroughly confused.
Or even worse you will convince yourself that any decision you end up making must be right because you’re so clever and you worked really hard.
We all have to end up making investing decisions without perfect information. You can collect as much information as possible to help you decide, but at the end of the day you won’t have ALL the information. Unless you’re the CEO of the company you are looking at. And even then you don’t have all the information (what if the largest shareholder has decided to dump their whole position on the market?).
So, success in trading can’t rely on you possessing all necessary information before deciding. Instead, it involves accepting that you don’t have enough information and acting anyway.
Where can we find useful information? Is it just in the company announcements?
The benefits of technical analysis
The price of the stock contains a lot more information than you might think. Every single investor meets at the share price when they enter and exit the stock. That includes the insiders who may have told their best friend that they should get a few shares on board before a big announcement.
You often get a hint that something is up prior to an announcement. Despite what the regulators would like you to think, insider trading is rampant in the markets. There are many companies that are renowned for being leaky ships.
Technical analysis is the only way you will get some information about what’s going on behind the scenes.
But technical analysis doesn’t just provide information about what insiders are doing. It also tells you how various traders are positioned and where they probably have their stop-losses.
I’ve already told you about the years I spent watching every second of trading on the Sydney Futures Exchange trading floor. The one thing that happened like clockwork was local traders (people who traded on their own account) shooting for stop-losses if prices got close to a key technical level.
They knew there would be stop-losses below a key level, and they would work together to push prices through the level to set the stop-losses off. Then they would cover their position, buying back contracts from the people who were selling due to their stop-loss being hit.
Then once the stop-losses were done prices would bounce back above the level and shoot higher again.
This process went on all the time whether prices were breaking out above a key resistance level or below a support level.
Traders have a habit of thinking about price action in a linear way. Prices are either going to go up or they will go down. We usually extrapolate current price action and have trouble thinking of the future in a non-linear way.
Rather than observing price action and learning from it, most traders will learn a few patterns from a technical analysis book written over 50 years ago. Then they go searching for what they believe the pattern is without really understanding why the pattern occurs.
The technical analysis I rely on is built by me from the ground up based on direct observation of price action. It is based on understanding how traders behave and where their stop-losses are.
One of the main things to understand about price action is that false breaks occur far more often than breakouts.
The reason is explained for you above. If prices break out above a key resistance level, traders who were short will scramble out of their position. Traders who think a breakout is occurring will enter new positions trying to catch the breakout.
Once the shorts have capitulated and the new longs have entered their position, the music can stop, and prices can rapidly fall back below the old resistance zone.
The same thing will happen when prices break below a support level. Longs will hit the sell button and bears will enter new shorts thinking prices will fall further.
Buyers will back off due to the strong selling pressure, but once the selling is done they will return and prices can shoot higher rapidly due to the vacuum of sellers.
Visualising this process leads to one of the universal structures that I see across all time scales and all markets. I have written about it many times in the past, but since I have just started this weekly ‘Trader’s Corner’ it is important for me to set it out again clearly for new people.
It is the cornerstone of my trading approach because there are so many interesting characteristics of these structures that can be used to build trading plans.
Widening distribution
The universal pattern I am talking about is the widening distribution:
|
|
| Source: Port Phillip Publishing |
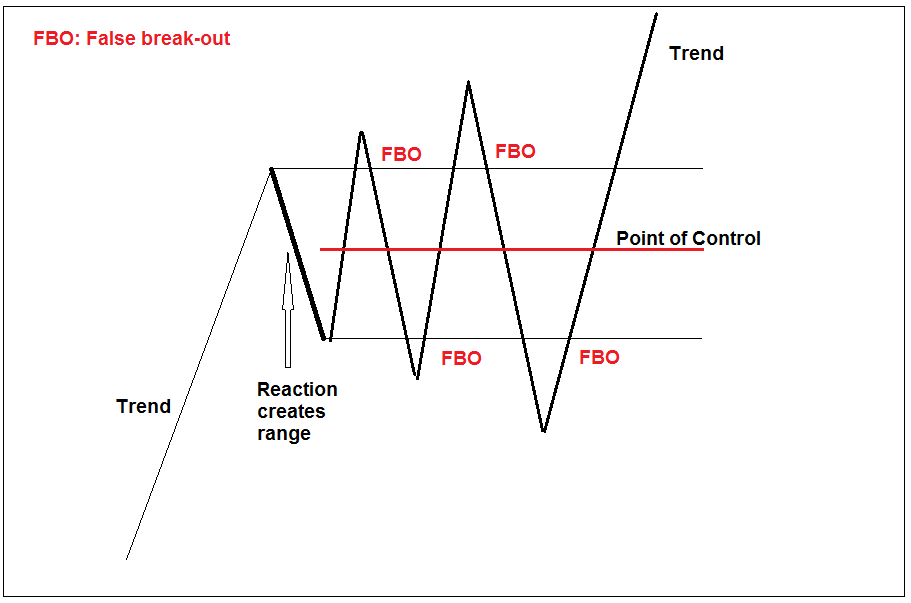
If you have read any of my articles in the past you have probably seen the above picture and I apologise for going over old ground. But it is imperative that you understand what the pattern is and why it happens if you want to continue reading my articles in future.
[conversion type=”in_post”]
When I find a good trading opportunity it will involve various aspects of the theory behind the widening distribution.
The Point of Control (POC) that you see in the above picture should be thought of as a gravitational point around which prices are oscillating. Prices constantly go back over old ground shaking traders out of positions before being ready to shoot off into a new trend.
If you don’t understand the process, you will be a victim of it.
Over the next few weeks, I am going to go into detail about the various characteristics of this pattern and how you can use it to improve your trading.
I will leave you today with a picture of the E-mini S&P 500 futures weekly chart and you can have a think about what it looks like now that I have told you about widening distributions. Does the chart make you feel bullish or bearish?
E-mini S&P 500 futures weekly chart
|
|
| Source: CQG Integrated Client |
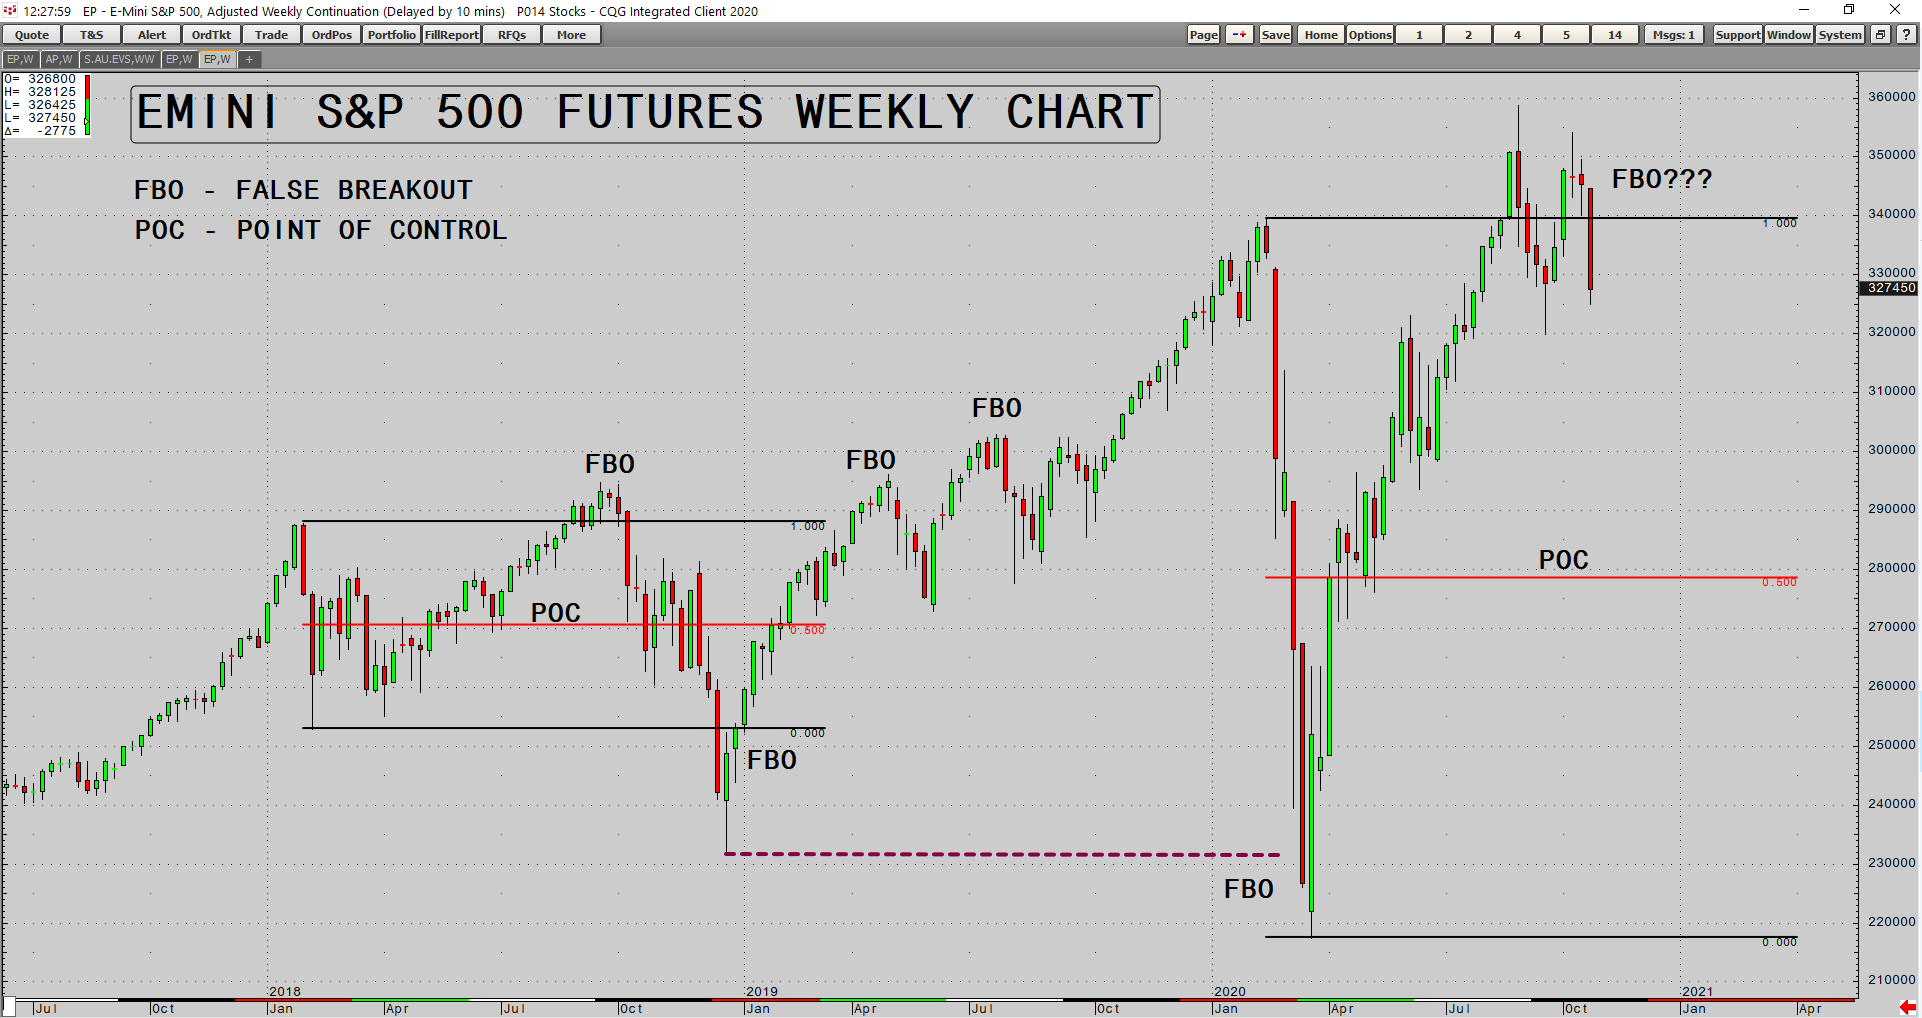
The US election is only days away and it is clear investors are lowering exposure to the market in case the outcome is unexpected and leads to huge volatility.
The technical set-up certainly looks dangerous to me and I have been lowering exposure in my trading service Pivot Trader over the last few weeks.
I know Jim Rickards thinks we are entering a period where we could witness a huge financial reset, so if you want to find out what he sees happening over the next year you should check it out here.
Regards,
 |
Murray Dawes,
For Money Weekend

Comments