In today’s Money Weekend…the bond conundrum…demand shock inflation…the widow-maker trade…the opportunity…and much more…
The biggest question on everyone’s lips is, is inflation transitory or not?
Then the next question becomes what should I do about it?
The surge in inflation numbers over the past few weeks has caught most people off guard, and I don’t think the market is well-positioned for a sustained period of high inflation.
We may still be in the early stages of a shift in market positioning. In other words, there may be some fireworks to come if inflation numbers continue to deteriorate.
The counter-intuitive move in US 10-year bonds after taper was announced had me scratching my head. Instead of selling off on high inflation numbers — as you would expect — the 10 years actually rallied!
With headline inflation numbers at 6.2% and US 10-year bonds yielding 1.58%, that means this year investors face a 4.62% deterioration in purchasing power.
If we extrapolate those numbers over 10 years, you will end up with $62.30 for a $100 investment.
I don’t know about you, but if someone asked me to borrow $100 and said they promise to give me back $62.30 in 10 years, I’d squint my eyes at them and consider punching them in the nose.
Of course, I’m not saying inflation is going to sit at 6.2% for the next 10 years. I’m just making the point that we are at a crossroads and investors have a lot to lose if they get their views on inflation wrong from here.
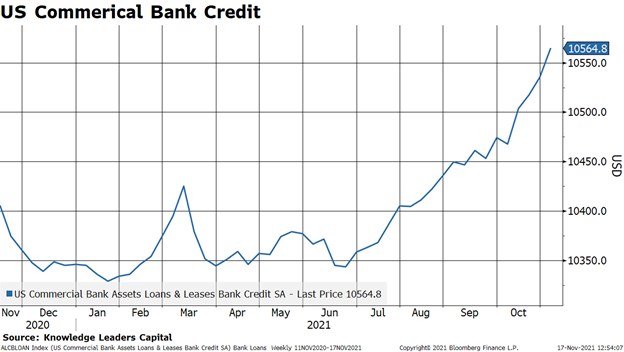
The velocity of money looks like it’s picking up steam in the US with commercial bank loans starting to trend higher.
Banks starting to lend
|
|
|
Source: ZeroHedge.com |
If the velocity of money starts to kick into gear, that’s when inflation will start to gallop away from the Fed.
Demand shock inflation
I made the case last week that what we’re seeing isn’t just a supply disruption due to COVID, but a demand shock due to the immense monetary stimulus unleashed on the world during the COVID crisis.
Bridgewater Associates wrote a great article with plenty of brilliant charts in it, which I highly recommend you read.
The most poignant line said:
‘The MP3 response we saw in response to the pandemic more than made up for the incomes lost to widespread shutdowns without making up for the supply that those incomes had been producing.’
If they are right and the current spike in inflation has been caused by the Fed and will continue to get worse as long as monetary conditions remain extremely loose, investors should be thinking long and hard about how their portfolio is positioned going forward.
I’ve been contemplating the best way to play it and I have concluded that entering the ‘widow-maker’ trade might be the way to go.
The widow-maker trade
The widow-maker trade is attempting to go short the long end of the yield curve in the US. Many have tried over the years and been carried out in body bags.
But I think the situation is deteriorating to the point where the risk/reward of going short bonds is stacking up, and it would act as a natural hedge on your other equity positions.
If the bonds do get smoked, equities will definitely stumble, especially the market darling (tech stocks).
I can’t see US 10-year bond yields falling very far while real yields are so negative and with inflation still not showing signs of topping out. So the downside seems quite limited to me.
But if inflation continues to surprise to the upside, I can’t see investors remaining sanguine about having nearly 5% of their purchasing power stolen from them every year.
If US bonds do sell-off, they could move a long way very quickly.
As I said a few weeks ago, I reckon the 10-year yield will spike to 2.2% quickly if the 1.8% resistance level is breached.
The opportunity
I have found a couple of ETFs I reckon could be worth looking into if you agree with me that the risk is to the upside in yields.
The first one is the ProShares UltraShort 7-10 Year Treasury ETF [NYSE:PST], which is two times leveraged and currently trades at US$16.33.
The other is the Direxion 20-Year Treasury Bear ETF [NYSE:TMV], which is three times leveraged and trades at US$57.67 currently.
TMV is incredibly volatile due to the extra leverage and has probably been the worst investment you could make over the past decade.
Its price has fallen from above US$5,000 to the current level of US$57.67 since 2009! Yikes.
So if you were to consider such an ETF, you would have to understand the leverage and how volatile the price of the ETF could be so that your placement of stop-losses is correct.
I’m very interested to delve into the COT (Commitment of Traders) data that will be released on Saturday (I’m writing this on Friday afternoon).
You go down to the financial section and press on ‘long format’ to access the data, and then scroll down to find the US Treasuries and US 10-year bonds.
The data will show the movement in positions from 9–16 November, which aligns well with the sharp sell-off in US 10-year bonds from 1.41–1.64%.
The data is usually a bit ho-hum because there’s rarely a smoking gun that lets you know what the big players are up to. But this week’s COT data should give some valuable insights into who was selling when bonds collapsed after the latest inflation data spooked the markets.
If you want to get a detailed technical analysis of how the US 10-year bonds are currently set up and why I think yields could spike quickly and how you should play it, check out my Closing Bell video below.
Regards,
 |
Murray Dawes,
For Money Weekend
PS: Watch the latest episode of my series ‘The Closing Bell’ on YouTube. Click here or the thumbnail below to view it.


