
In today’s Money Weekend…on the precipice…monthly chart bearish…weekly chart bullish…where to next?…the opportunity…and more…
In last week’s article I warned you that gold was looking shaky and gave you targets to US$1,610 if gold cracked beneath US$1,764.
Gold was trading around US$1,820 at the time and since then the price has nosedived to the current price of US$1,769 (I wrote this article on Friday). Just $5 above the $1,764 level I gave you last week.
In other words, gold is on the edge of the precipice.
So, I thought I would spend this week going into a deeper analysis of the gold price to give you an understanding of why I have such a negative view in the short term.
If you have been paying attention to my articles you should understand my technical approach. It is based on the idea that mean reversion happens all the time and false breaks occur far more often than not.
Traders are constantly shaken out of positions by the process of mean reversion. False breaks of key levels whether above or below the market is what stops so many traders out of their positions or tempts them into entering positions at exactly the wrong time.
When you understand the process, you can avoid being a victim of it and start looking for ways to capitalise on the mistakes made by other traders.
Monthly Gold Price Chart Bearish
The first thing to note about the gold price is the long-term picture.
Monthly gold chart
|
|
| Source: Tradingview.com |
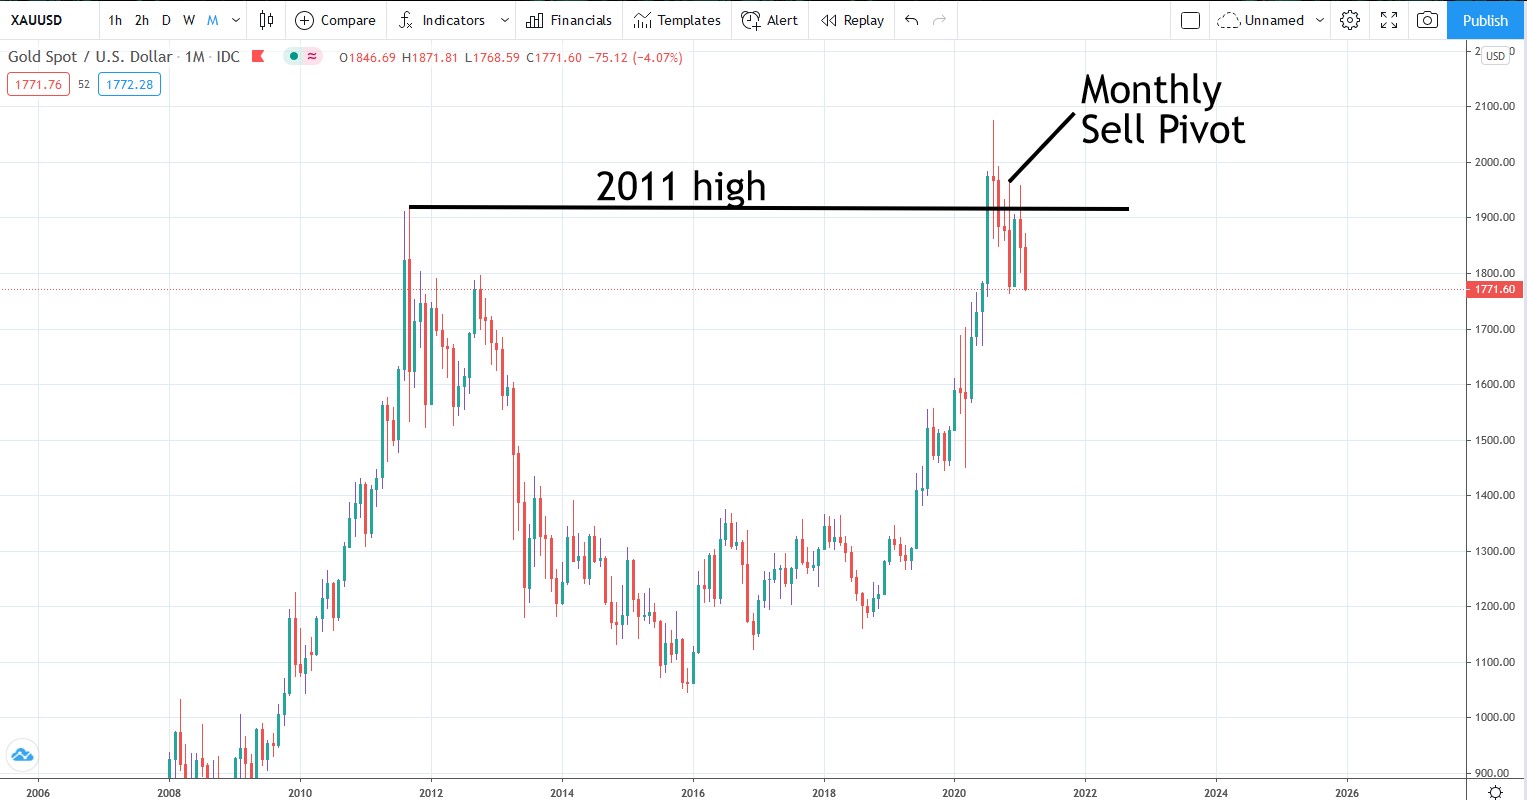
There are two major things to point out.
The first is that a false break of the 2011 high is a likely outcome regardless of whether gold will end up going much higher in the long term.
Prices have been flirting with the 2011 high for months and the recent retest of it has been rejected.
The next major thing to point out is that the monthly sell pivot was confirmed three months ago.
Price action since then has seen a rally back to the point of control of the wave down from the all-time high — which has been sharply rejected — and prices are now falling quickly to the bottom of the recent range.
Weekly Gold Price chart bullish
Now we need look at the weekly chart and analyse what’s going on.
Weekly waves in gold
|
|
| Source: Tradingview.com |
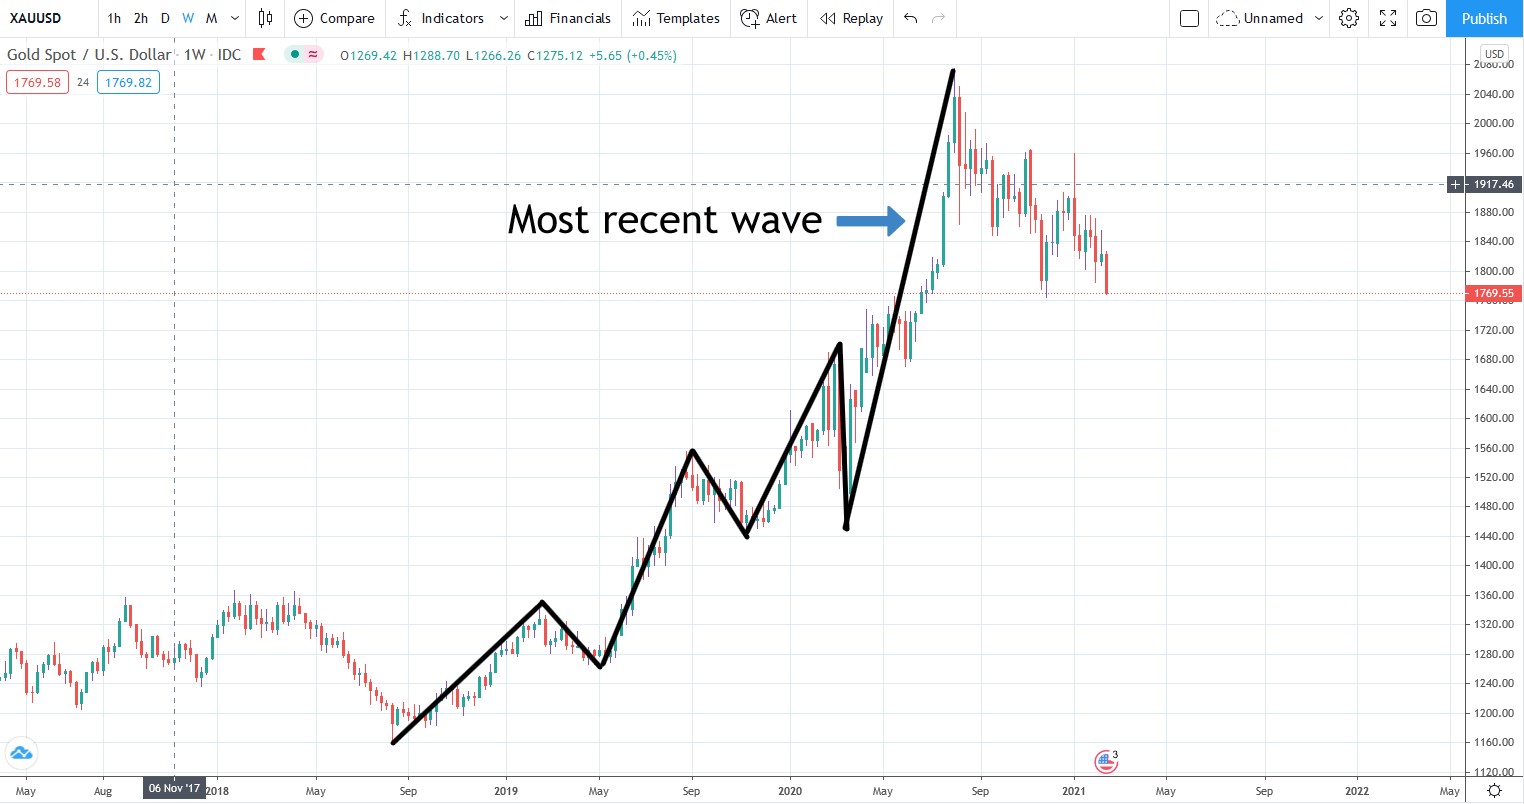
The black lines above show you the waves in the trend to the upside since August 2018.
It’s been a strong rally and the price of gold would have to fall a long way to threaten the uptrend.
If prices fall below the low of the most recent wave to the upside (see chart above) then I would say that the uptrend is over.
The low of the most recent wave is at US$1,451 — which is miles away.
In other words, the price of gold can fall a long way and still remain in uptrend according to the weekly chart.
Where to next for Gold?
Let’s have a look at the most recent wave to the upside to understand what’s going on and what might come next.
Most recent weekly wave
|
|
| Source: Tradingview.com |
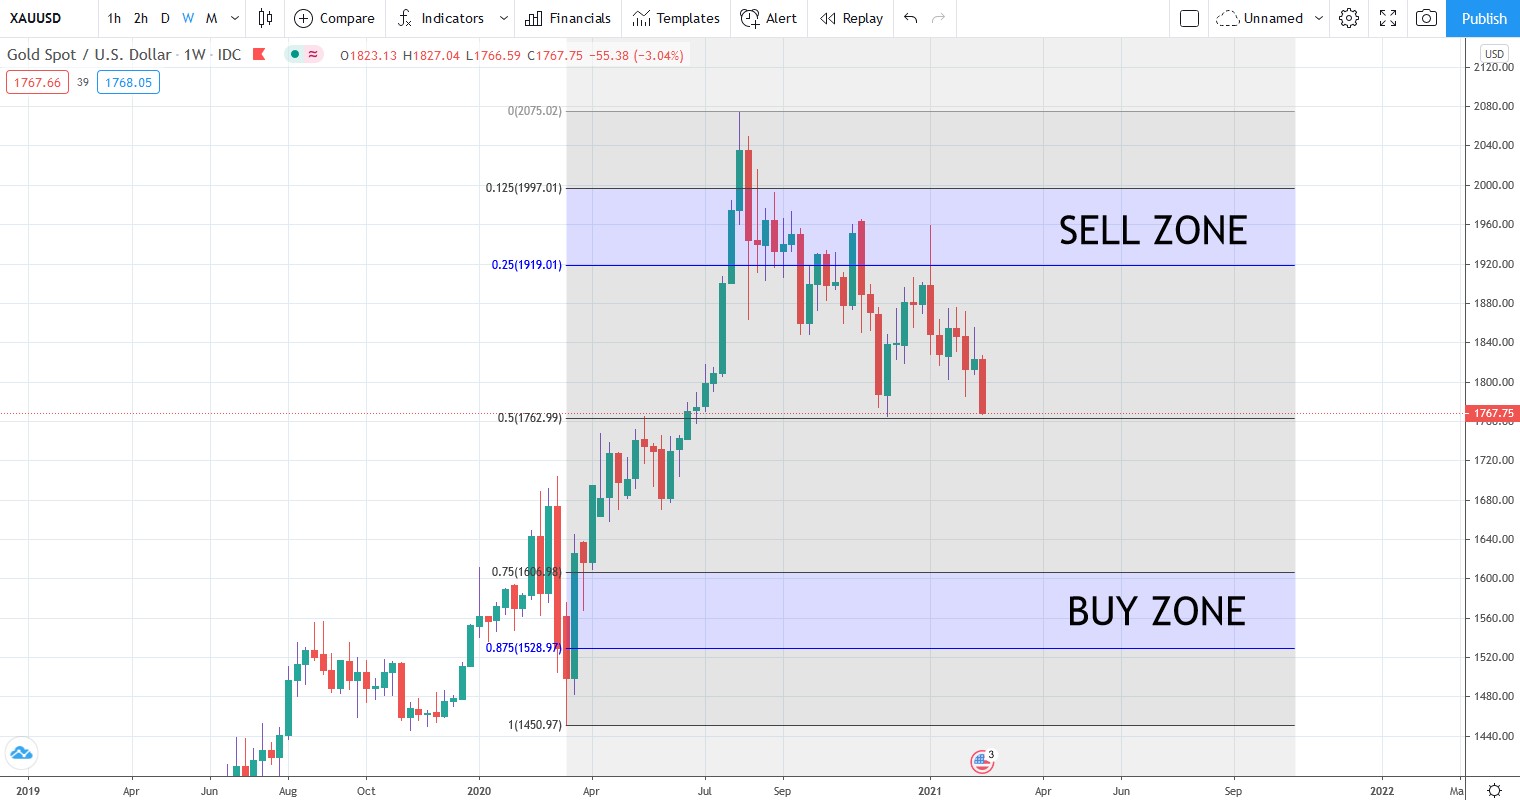
I have added in my key support and resistance zones within the wave.
The sell zone of the wave is in the area that is a 12.5–25% retracement of the wave.
The buy zone is the mirror image of that which is the 75–87.5% retracement of the wave.
The midpoint is the point of control which behaves like a magnet for price action.
Notice how prices initially fell to the point of control of the wave at US$1,764 late last year and then bounced viciously up into the sell zone of the wave where strong selling pressure was present.
Prices have since fallen sharply back to the point of control.
Once the point of control gives way I have targets to the buy zone of the wave which sits between US$1,528 and US$1,610.
Now you know why I gave you the target of US$1,610 last week if US$1,764 can’t hold.
If the weekly uptrend is going to continue there should be plenty of buying pressure in the buy zone of the wave.
The opportunity in Gold
It could end up being a fabulous opportunity to get long gold for the next leg higher in the bull market. If you have been waiting for your opportunity to join the trend and haven’t pulled the trigger yet you should be getting prepared for what is to come.
If you need to scrub up on your reasons for remaining bullish on gold even when it’s dropping through the floor, you should check out Jim Rickards’ new book: The New Great Depression: Winners and Losers in a Post-Pandemic World. He is always a great read and this book is even better than the last.
The book talks about the long-term ramifications of the global pandemic, what a post-pandemic world might look like, and direct strategies you can use to survive and thrive in a post-pandemic world.
If you grab a copy now you also get a bonus chapter by Nick Hubble outlining where Australia fits in the post-pandemic world. He discusses which stocks should do well and the ones that might tank. He also analyses what the long-term implications are if Australia remains shut off from the rest of the world due to the pandemic.
The book won’t be released until sometime next month, but we have an exclusive ‘early access’ deal with his international publishers.
Regards,
 |
Murray Dawes,
For Money Weekend

Comments