In today’s Money Weekend…bonds throw a dummy…what goes up must come down…so what about gold?…and more…
In last week’s article, I was scratching my head wondering why on Earth US 10-year bonds had rallied after hot inflation figures and the minutes from the FOMC meeting confirmed taper was on its way.
A flattening yield curve after such news was quite amazing to me and I thought gold must start rallying.
Fast-forward a week, and it looks like the knee-jerk reaction that saw buying in the 10-year bonds has reversed, and yields are now sitting above where they were when the minutes were released.
Now this sounds monumentally boring, I know, but stick with me.
The reason why I am so focused on the US 10-year bonds is because the technical situation looks quite compelling that if yields break through the high reached earlier this year, we could see quite a dramatic sell-off and spike in yields.
The market isn’t expecting that, so it will probably start to weigh on stocks and gold at some point.
Forewarned is forearmed, so let’s have a look at the set-up, so I can show you why I reckon US 10-year bond yields could spike to 2.2% if they head above 1.8%.
What goes up must come down
The cornerstone of my approach is that mean reversion is one of the universal characteristics of price action.
Whether you are looking at a five-minute chart of wheat or a monthly chart of the S&P 500, prices are constantly thrashing around, going over old ground, tempting traders in at bad levels, and then shaking them out.
When a market is caught in a range, it will often have multiple failed attempts at leaving the range. When an attempt to leave the range fails, it is usually a quick trip back to the centre of the range. That’s the ‘point of control’ I keep talking about.
The US 10-year bonds have been trading a range for the past decade. The collapse in yields that we saw during the COVID crash saw a large move outside the decade-long range, but we are racing back towards it.
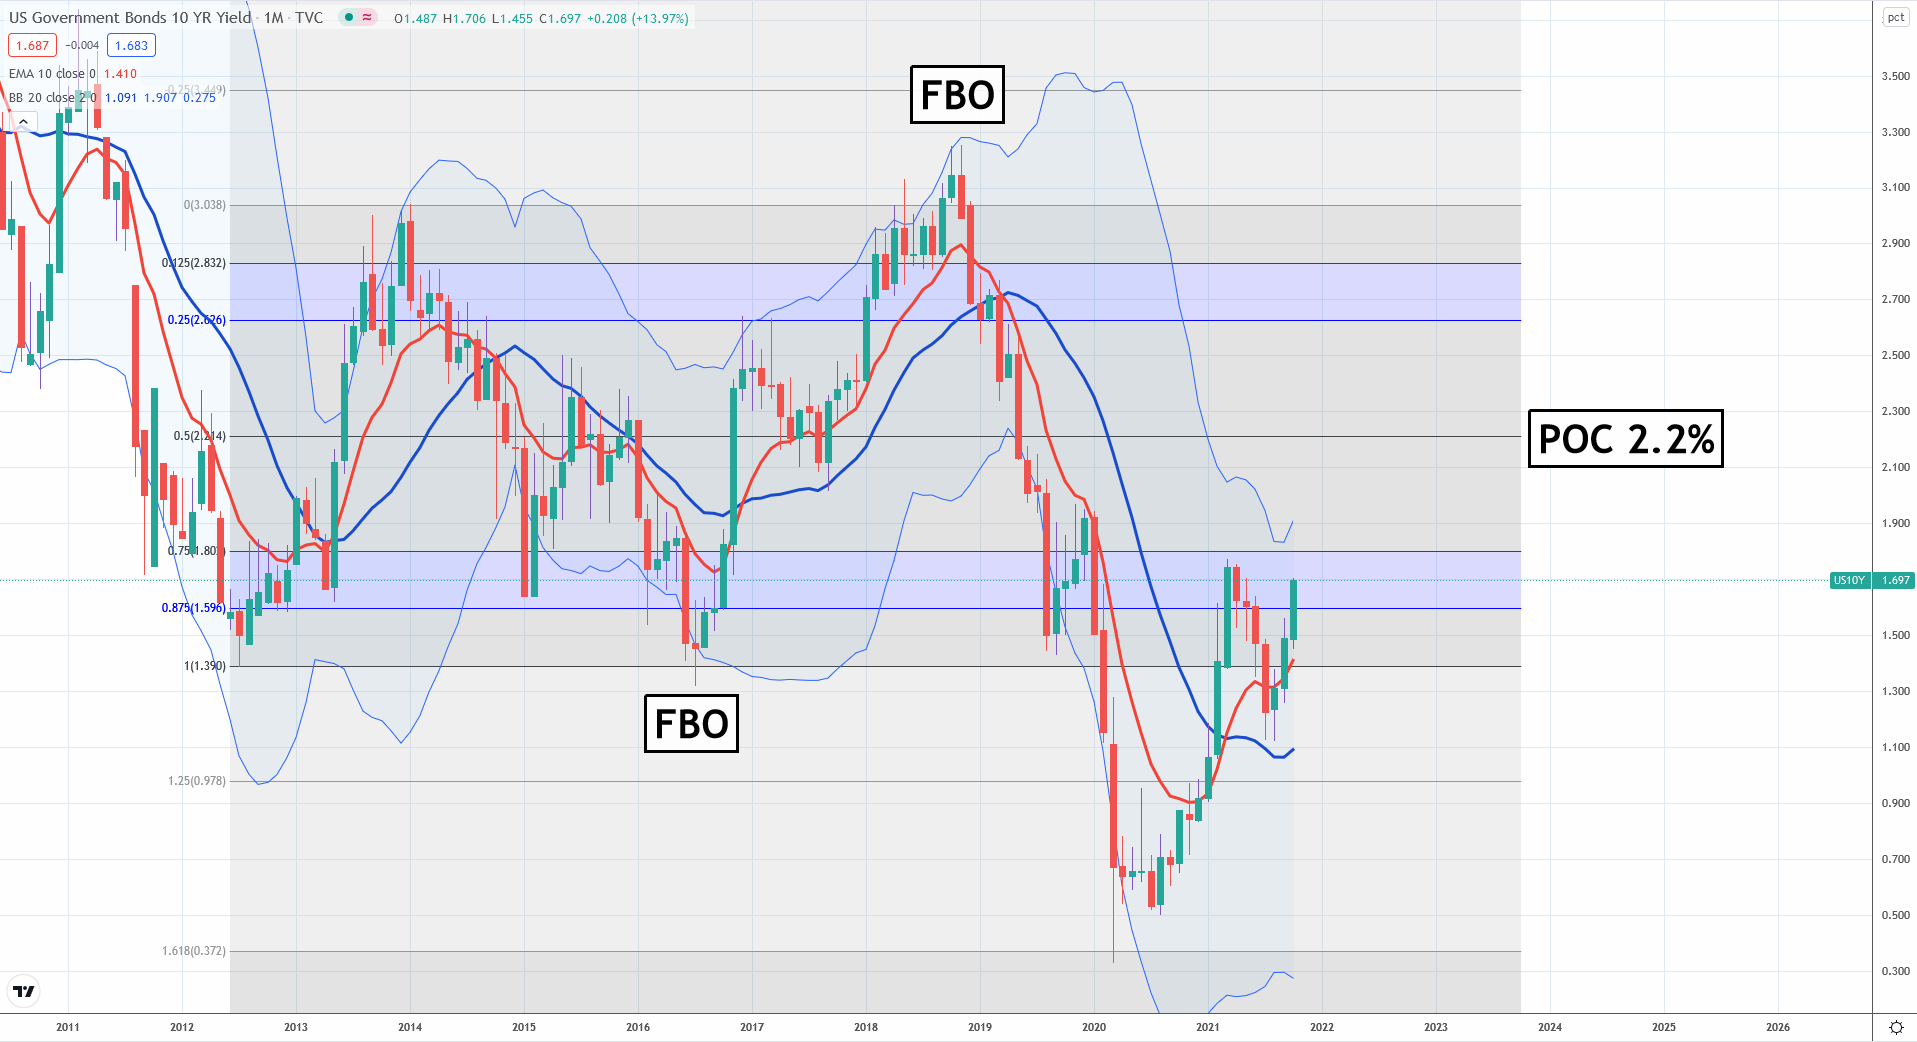
Let’s have a look at the chart so you can see what I mean. This is a chart of US 10-year bond yields. The price of the bond moves inversely to the yield, so when the yield is going down, the price is going up, and vice versa.
How to Limit Your Risks While Trading Volatile Stocks. Learn more.
US yields ready to spike
|
|
|
Source: Tradingview.com |
The initial range between 1.4–3% was created with the rise in yields from 2012–14. Since then, we have seen two false breakouts (‘FBO’ in the chart above).
Notice how quickly yields returned to the point of control (POC) at 2.2% once the attempt to leave the range failed?
When you see a huge move like we saw during the COVID crash, it is tempting to assume that the range is no longer valid, but that’s incorrect.
I have two areas outside a range that I’ve noticed act as great levels of support or resistance. The major one is the Fibonacci level, 61.8% outside a range. That level was the exact low in yields that we saw last year.
Since then, we witnessed a rapid rise in yields from 0.33% to 1.78% in March this year.
Yields dropped for the next four months but have since jumped to within spitting distance of the March high.
That looks like a cocked gun to me. The long-term trend in yields is now up, with the 10-month exponential moving average above the 20-month simple moving average (red line above the blue line).
I always like to see a retest of the moving averages after a trend shift, and if you find support there and prices continue in the direction of the new trend, it is often a solid trend for a while.
I need to see yields heading above the 1.8% region to set off the chain reaction, though, so it hasn’t been confirmed as a likely outcome yet.
So what about gold?
Gold prices have been holding in there quite well this week, despite the fact bond yields have made a U-turn.
There are plenty of dominoes lined up in gold if prices can head above US$1,800, but the selling pressure remains, so it is a bit touch and go whether gold can keep rallying in the face of rising real yields.
Gold stocks remain battered and bruised after the correction of the past year, despite the fact they are churning out cash at a rate of knots. There is an opportunity brewing but it all comes down to timing.
I may have jumped the gun a little sending a trade alert last week to buy a bunch of gold stocks (to members of my service, Pivot Trader), but I have given the trades a lot of room to move with wide stop-loss levels, so we can withstand some volatility if a spike in yields causes the gold price to fall.
Gold stocks have fallen so far that they are starting to look like good value, so I am happy to start picking some up, and if we see a swan dive in gold due to weakness in bonds, I will probably scoop up a few more.
Check out my Closing Bell video below where I show you the current situation in detail and update you on a few of the stocks we have been watching.
Regards,
 |
Murray Dawes,
For Money Weekend
PS: Watch the latest episode of my series ‘The Closing Bell’ on YouTube. Click here or the thumbnail below to view it.


