
‘You have power over your mind — not outside events. Realize this, and you will find strength.’
~ Marcus Aurelius
Real knowledge is in knowing True Value
We have no control or influence over what the Fed or any central bank may or may not do.
We cannot control the level of incompetence exercised by elected officials.
The only thing we have power over are our own thoughts and actions.
Knowledge is the key to successfully navigating, what I anticipate, is going to be a very challenging period ahead.
What we think we know (based on a multitude of long-established valuation metrics) is the US share market peaked in late 2021, at what can be best described as…an extremely over-valued level.
Historically, over-valued and under-valued markets go through a time-honoured process of ‘mean reversion’…falling to lower levels or rising to higher levels.
John Hussman’s ‘Durable Gains’ chart — tracking the emotional ebb and flow of the S&P 500 (blue line) against the mathematically determined ‘True Value’ (green line) since 1928 — illustrates how, over the longer term, the S&P 500 ‘ducks and weaves’ its way around the level of ‘true value’.
When social mood is less than upbeat — Depression, The Second World War and the Inflationary 1970’s — the S&P 500 falls below its True Value…a signal to buy…one most people ignore.
Conversely, if people’s spirits are buoyed by a feeling of prosperity (the 1950s and 60s and 1995 onwards), the S&P 500 is pushed higher by a feel-good air of optimism…a signal to reduce exposure…again, one most people ignore.
|
|
| Source: Hussman Strategic Advisors |
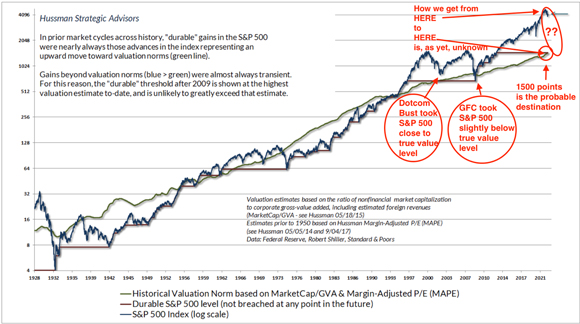
In more recent episodes of exuberant pricing — Dotcom & US Housing bubbles — the S&P 500 took flight from its line of True Value.
As we know, these flights were fanciful in nature and fleeting in duration.
After the Dotcom bust, the S&P 500 almost reverted to the True Value line.
The GFC dished out much harsher treatment to share investors…taking the S&P 500 below its true mathematical value.
In response to the greatest credit crisis since The Great Depression, the Fed — courtesy of multiple rounds of Quantitative Easing (QE) and ultra-low rates — launched another flight of fantasy…one, that until recently, had defied the gravitational pull of True Value.
However, as we’ve witnessed many times before, excesses ultimately do get corrected.
And, that process has now begun.
From its late 2021 peak, the S&P 500 index has only surrendered around 10%.
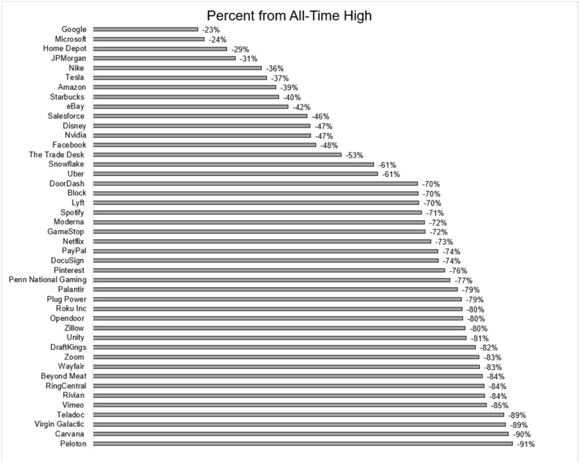
On an individual share-by-share basis, it has been a different story.
The price carnage for some shareholders has been brutal…especially those who went for the ride on Peloton (couldn’t resist)…
|
|
| Source: Y Charts |
Jeremy Grantham has spent decades researching financial markets and bubbles.
His timing is not always perfect — he was early on his calls with Japan, Dotcom and US Housing — but, in the end his analysis proves to be highly accurate.
Here’s what Jeremy Grantham has learned from his 50-plus years in the investment business (emphasis added)…
‘The history books are pretty clear, there doesn’t have to be a pin. No one can tell you what the pin was in 1929. We’re not even certain in 2000. It’s more like air leaking out of a balloon. You get to a point of maximum confidence, of maximum leverage, maximum debt, and then the air begins to leak.
‘And I like to say, the bubble doesn’t reach its maximum and then get frightened to death, what happens is the air starts to leak out slowly because tomorrow is a little less optimistic than yesterday. And gradually, people begin to pull back. And the process is very interesting, in that before the end of the great bubbles, and there’s only been a handful, so we can get carried away with over-analysis.
‘But before the great bubbles ended in 1929, 1972, and in 2000 in the US, the three great events of the 20th century, there was a very strange period in which, on the upside, the super-risk, super-speculative stocks started to underperform.’
Outside of the ‘Magnificent Seven’ (Apple, Microsoft, Nvidia et al) there’s a growing list of dismal individual stock performances. The super-risk, super-speculative stocks [have] started to underperform…this folks, is the air beginning to leak out of the bubble.
The S&P 500 (due to the heavy weighting to the ‘Magnificent Seven’) is yet to fully reflect the shift in underlying investor sentiment. But, if the pattern of past great bubble-busts is repeated, it will…especially when the algorithmic index funds are triggered to SELL!!
As a cashed-up outsider looking in, I find current market conditions fascinating.
The Fed’s ‘higher rates for longer’ policy is impacting the long-end of the bond market…the cost of debt is getting uncomfortably high.
Which brings us to…
This chart should have you quaking with fear
The last time the US 10-year bond rate was around the 4.7% level was in late 2007…just before the GFC.
The difference between then and now?
An additional US$44 trillion (that’s 44,000 billion dollars) has been added to the US debt pile.
|
|
| Source: FRED |
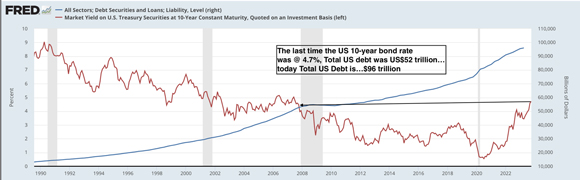
Wow. The worst financial and economic crisis since The Great Depression was triggered by a debt load that was a little over half of what it is today…and, everything is ok?
Have we collectively lost our senses?
That’s a rhetorical question.
Anyone who thinks this is going to end with a ‘soft landing’ is a supreme optimist.
We have THE most OVER-valued share market in history together with the greatest debt load in history, set against a backdrop of increasing geopolitical uncertainty and persistent inflationary pressures. What could possibly go wrong?
Another rhetorical question.
How the S&P 500 gets down from its emotional high to True Value (about a 65% fall) is going to make for captivating viewing.
While this plays out, I’m very happy to be a spectator earning 5% on my cash.
Until next week.
Regards,
 |
Vern Gowdie,
Editor, The Daily Reckoning Australia
