



The US Federal Reserve left rates on hold on Wednesday. The 30-year Treasury yield went the other way.
It climbed as much as 0.14 percentage points to 5.23%. That is the highest long-term US borrowing cost since 2007. The Nasdaq 100 fell 2.1% on the day.
Most of the coverage framed that as an inflation story. Iran, oil, tariffs, and a Fed under Kevin Warsh no longer issuing forward guidance.
Don’t issue guidance, and markets take the lead. It’s a fine idea.
But in a way, you could see the huge jump as the bond market saying rates need to be higher.
That is part of it. But there is a second reason the long end matters right now.
The AI build-out has started borrowing at a serious scale. And this year, the bond market becomes its marginal funder.
I have put the AI trade in the same breath as the dot-com bubble before. I want to revise that.
The wrong bubble
The question everyone is asking is whether AI is a bubble like the 2000 dot-com era.
That framing produces 2000-shaped answers. Leaders survive, laggards wash out, and you get a recovery.
Instead, I want you to view 2000 as an equity event. Too much optimism priced into companies with thin balance sheets.
Yes, there was huge debt, but it wasn’t the trigger of the crash. And it pales in comparison to today:
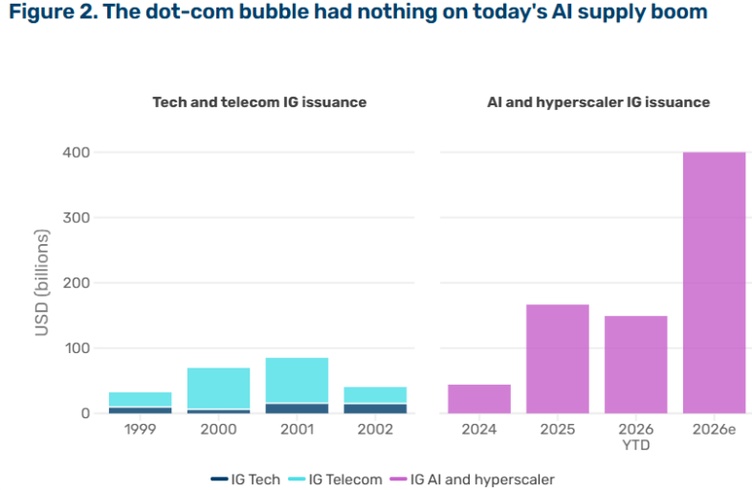
Source: Man Group (IG= Investment Grade Bonds)
[Click to open in a new window]
Today’s build-out is financed differently. It runs on opaque private credit deals, and contracted future cash flows borrowing against hardware — not on selling expensive shares.
The flavour of this cycle’s debt is: Take-or-pay capacity deals. Loans secured against GPUs. Off-balance-sheet vehicles. Asset-backed notes sold to insurers.
A recent Nikkei study showed that this off-balance sheet ‘shadow borrowing’ among US tech giants increased eightfold over roughly four years, now estimated at US$1.65 trillion.
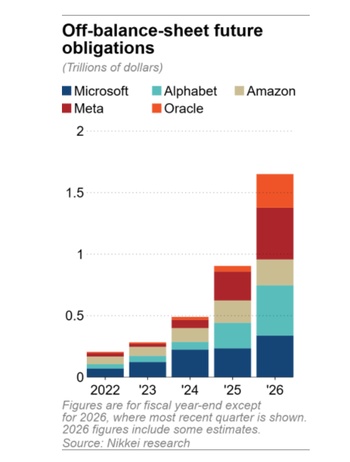
Source: Nikkei Research
[Click to open in a new window]
Under accounting rules, GPUs and servers under long-term contracts that have not yet been delivered — as well as lease agreements for data centres that are not yet operational — are treated as off-balance-sheet items.
And they continue to grow. That’s not the architecture of 2000. It’s the architecture of 2008.
A loan nobody calls a loan
Follow one of these deals through.
An AI lab signs a contract promising to pay a provider tens of billions of dollars over several years for compute it has not yet used.
The provider books that promise as backlog. Then it borrows against the backlog to pour concrete and rack chips. NVIDIA clips the ticket on the way through and then circulates the capital to another future customer.
Strip away the language of technology, and the skeleton is a loan. The data centre is the collateral. The contracted payments are the debt service.
So when a hyperscaler announces record capital spending, the press reads it as confidence. Read it as loan origination instead.
The numbers in May were around US$820 billion in promised future payments on data centres not yet built. A year earlier, that figure was US$270 billion. Most of it sits off-balance sheet.
Across the four big US platforms, contracted backlog runs to something like $2.1 trillion. Roughly half is owed by two frontier labs that do not yet turn a profit.
If they continue to service their obligations out of financing rather than earnings it puts them on a timer. They can only keep paying while each new funding round prices above the last.
That is a refinancing treadmill. It is the same structure that sat under subprime mortgages twenty years ago.
The number to watch
Here is the part the market gets backwards. Ask what caused 2008 and you will hear that house prices fell, borrowers went underwater, and the securities blew up.
The sequence is wrong. Subprime delinquencies turned up in 2006, while national house prices were still rising.
What changed was not the level. It was the rate of gain. Appreciation slowed from the mid-teens, and the refinancing machine stopped working.
Those loans never needed prices to fall. They only needed the rise to slow.
Because the loan was never designed to be repaid. It was designed to be refinanced. And refinancing depended on the collateral being worth more next year than this.
That is the test to apply here. Not whether the spending is large. It’s what has to keep rising for the structure to hold. Let’s look at what underlies it.
Server replacement cycles run 18 to 36 months. The bonds funding them run five to twenty years.
So the collateral rolls off long before the debt matures. To keep earning the revenue that services the 2026 bond, you have to buy the 2028 chips. Which means the next round of capital spending is not optional expansion. It’s becoming debt service in disguise.
That inverts how you read a capex increase. It’s not a blanket signal of confidence. It’s the treadmill running.
And it means that watching the capex growth percentage is far more important than whatever huge headline number they throw at you.
Here’s one such recent chart that points to my bearish concerns.
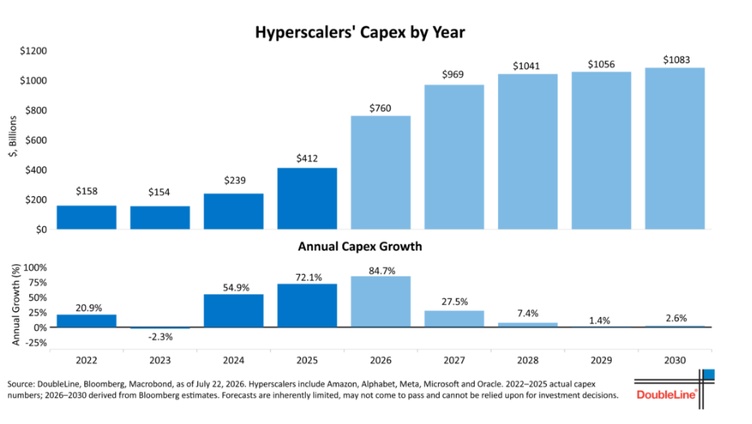
Source: DoubleLine
[Click to open in a new window]
The light blue is projections, and this is just one of many charts you can find.
Forecasts here tend to move in one direction, up. Alphabet has raised its 2026 guidance three times this year, most recently to as much as US$205 billion.
So I am not going to tell you that the spending has peaked. It hasn’t.
But if these kinds of projects become reality, then the house of cards could fall.
That leaves one question hanging.
Why do the hyperscalers’ keep raising the number every quarter?
The answer isn’t in any demand forecast. It sits in a piece of game theory from the 1970s, and it explains the behaviour better than anything said on an earnings call.
That is where I’ll pick this up on Saturday. Along with why this week’s move at the long end of the bond market is the thread that ties it all together.
Regards,

Charlie Ormond,
ATLAS and Altucher’s Investment Network Australia




Comments