It’s unclear if the breakdown can be arrested quickly — or at all. Consumers (and investors) should expect worse effects in the months ahead. How much worse remains to be seen…
Take the simple loaf of bread example we discussed last week. What could cause that supply chain to fail? The list of discrete points of failure is long. The farm might suffer a drought or lose its water allocation, causing the wheat crop to be delayed or to fail entirely. There might be a shortage of truckers to make timely deliveries to the wheat processor, the oven factory, or the bakery.
The baker might suffer labour shortages. Unionised workers in the grocery store might go on strike, causing trucks to be backed up on the loading dock or shelves to remain unstocked. The power grid might fail, stopping all of the processes in the chain at once. Baked bread might go stale before it can be delivered. The consumer might fear going outside because of the pandemic, leaving bread piled up on the shelves. Or all of the above.
Just as my supply chain description was simplified, this list of potential breakdowns and bottlenecks is also simplified. The point is just to acquaint you with how complex supply chains really are and how vulnerable they are to breakdowns.
All of the supply chain links, and possible bottlenecks described above, are purely domestic. I’ve described local farms, factories, bakeries, and stores. Consider that very few supply chains are actually that local. CEOs, logistics engineers, consultants, and politicians have spent the past 30 years making supply chains global. You’ve heard discussions of globalisation since the early 1990s. What one may not have realised is that the process that was being globalised was the supply chain.
The global assembly line
You know your iPhone comes from China. Did you know that the specialised glass used in the iPhone comes from South Korea? Did you know the semiconductors in the iPhone come from Taiwan? That the intellectual property and design of the iPhone is from California? On top of all of that, the iPhone includes flash storage from Japan, gyroscopes from Germany, audio amplifiers, battery chargers, display port multiplexers, batteries, cameras, and hundreds of other advanced parts from all over the world.
In total, Apple works with suppliers in 43 countries on six continents to source the materials and parts that go into an iPhone. That’s a quick overview of the iPhone supply chain. Of course, every supplier in that supply chain has its own supply chain of sources and processes. Again, supply chains are immensely complex.
Once the global perspective is added, we have to expand our transportation options from trucks and trains to include ships and planes. That means ports and airports are additional links in the chain. Those facilities have their own links and inputs, including cranes, containers, port authorities, air traffic controllers, pilots, captains, and the vessels themselves. And to our list of trucks, trains, ships, and planes, we can add pipelines that transport liquids such as petroleum, gasoline, and natural gas.
Supply chains affect everything. When they break down, everything gets worse at the same time.
Bottlenecks, backlogging, and breakdowns
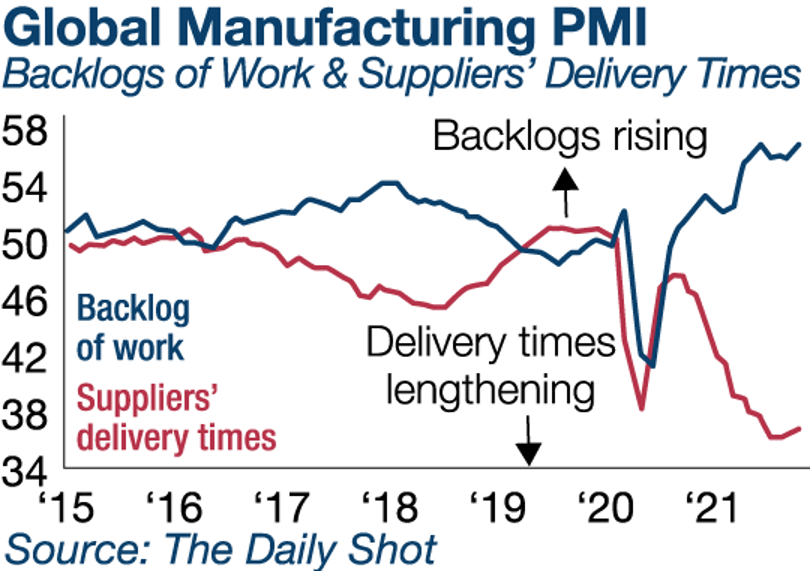
The evidence for supply chain breakdown is clear. The chart below shows an index of backlogged orders in the global manufacturing supply chain (blue) and an index of delivery times in the supply chain (red):
|
|
|
Source: The Daily Shot |
As can be seen from the chart, backlogged orders have spiked to the highest levels since at least 2015. This is happening even with delivery times lengthening to the longest delays over the same period, even longer than the delays during the pandemic lockdowns in 2020.
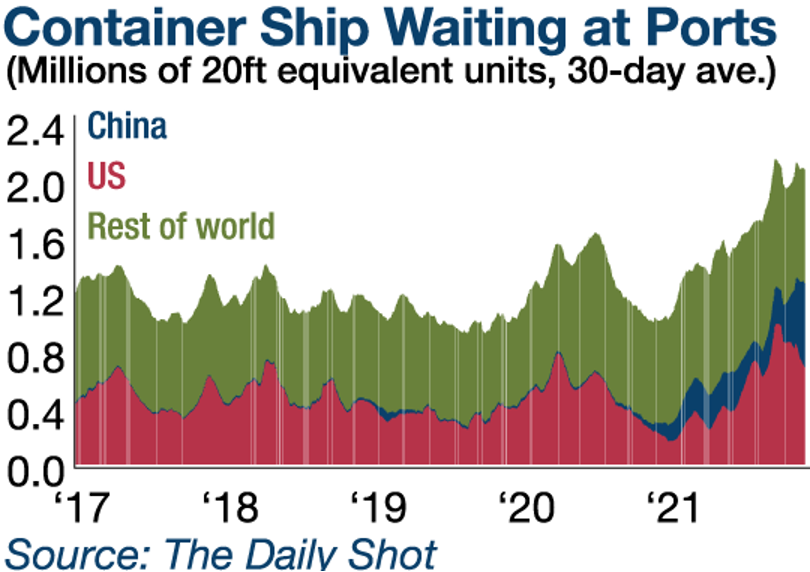
The next chart shows further evidence of a supply chain breakdown, with specific reference to the global container ship bottleneck. Containers are typically referenced as 20-foot equivalent units (TEUs), which refers to one standard 20-foot container.
Standard containers can also be 40-feet long, which equals two TEUs. The largest container ships in the world may carry 20,000 TEUs, although ships of that size can’t pass through many ports and canals.
|
|
|
Source: The Daily Shot |
This chart shows that vessels with a total of 2.1 million TEUs are currently waiting to unload at global ports. This is substantially more than the 1.7 million TEU backlog at the height of the 2020 pandemic lockdowns (when dockworkers and crews were frequently under quarantine) and is far more than the usual 1.3 million TEU backlog that prevailed from 2017–20.
It’s also noteworthy that this container cargo backlog is not limited to the US. The Chinese component is larger than the US, and the rest of the world is almost equal to the US and China combined. Again, this illustrates the global nature of the problem.
In my next edition, I’ll focus on one particular bottleneck in this global problem…make sure you tune in to find out all about it.
Regards,
 |
Jim Rickards,
Strategist, The Daily Reckoning Australia
This content was originally published by Jim Rickards’ Strategic Intelligence Australia, a financial advisory newsletter designed to help you protect your wealth and potentially profit from unseen world events. Learn more here.


