First, it was the US.
Then, it was China’s turn.
Europe is expected to go big this week too.
What am I talking about?
Interest rate cuts, of course!
As you might know, last week, The People’s Bank of China (PBOC) joined the US Fed in cutting key benchmark interest rates by 0.5%.
At the same time, they announced a wave of proposed spending plans to support housing and drive local consumption.
If it all goes through, there will be over US$2.08 trillion in spending over the next two years, which would add a whopping 4% to China’s economy.
But that wasn’t all…
The Politburo also cut the required deposit required on second homes from 25% to 15%.
And perhaps, most amazingly, the PBOC announced plans to give funds, insurers and securities dealers, access to lending facilities to buy stocks!
Make no mistake, the big two are printing for growth!
Taken together, the US and China account for around 43% of global GDP.
And as I said at the start, the European Central Bank (ECB) is widely expected to cut rates soon too, due to sluggish growth figures coming out of Europe.
The EU makes up another 15% of the world’s economy, so that’s well over half the world in cutting mode.
Of course, our own RBA declined to join the party, but in the grand scheme of things, that doesn’t matter.
The RBA was slow to rise and might be slow to cut too.
But I believe they’ll start cutting soon enough, despite their tough talk about inflation last week.
Anyway, my point is that the global liquidity taps are about to be turned back on.
And already certain sectors are starting to move.
Let’s examine where the hot money is going and how this might play out over the rest of the year…
Four charts show the surge is on
A bunch of sectors are starting to surge.
Let’s look at some of them…
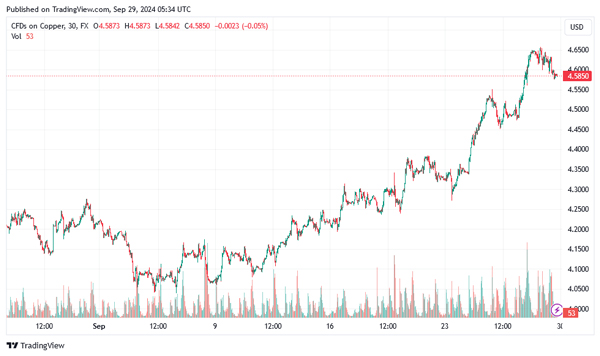
Here’s the 1-month copper chart:
| |
| Source: Trading View |
Here’s the 1-month chart of a major uranium stock index:
| |
| Source: Trading View |
Here’s a chart of an index of high-yield US corporate debt over the past 6 months:
| |
| Source: Trading View |
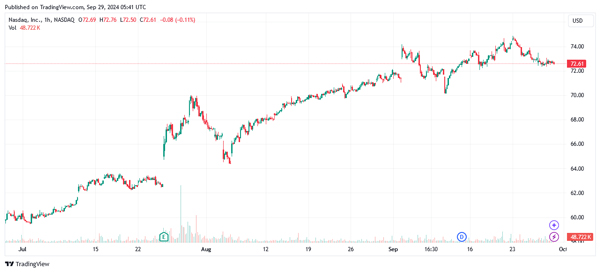
And here’s the 3-month chart of the tech-focussed Nasdaq index:
| |
| Source: Trading View |
At first glance, all these four sectors may seem very different.
But they have one thing in common.
They’re all what I’d call ‘risk on’ trades.
They’re the kind of speculative sectors that start to move when investors start to get bullish on markets.
As you can see, it’s already happening.
And I think it’ll continue.
As I pointed out a few weeks back, over US$6 trillion is currently in money market funds.
Some of that will start to look for a new home as interest rates come down.
In short, a wall of money is moving back into markets, and that’s generally bullish, no matter the reasons.
Forget fancy macro-economic theories, forget a stock’s intrinsic value, and forget most other fundamental analyses…what really matters is money flow.
And the dirty little secret of investing is that markets react to global liquidity – more money sloshing around – more than anything else.
When central banks create more of it, investors put it to work in markets.
But there’s one problem…
The sting in the tail
Of course, some of this money printing might feed the inflation beast too.
Check out this chart:
| |
| Source: Bittycent |
While headline inflation might be coming down, you need to remember the previous price rises are now baked in.
If you didn’t get a 30-40% pay rise over the past five years, you’re probably a lot poorer in real terms now!
The only way to stay ahead of the inflation game is to invest in assets that can help you grow your wealth at a faster clip than inflation.
But where?
Some recent analysis I came across last week actually quantified the sectors likely to benefit most from a rise in global liquidity.
Let’s take a look…
The best liquidity trades
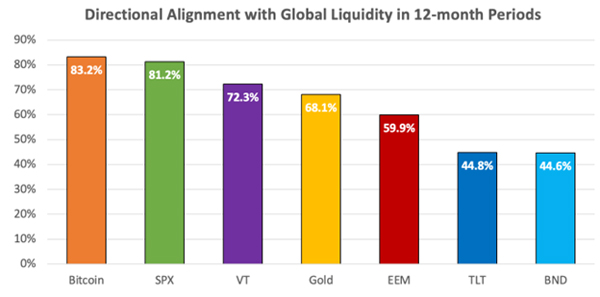
Check out this table:
| |
| Source: Lyn Alden |
This table shows certain sectors and how they correlate to changes in global liquidity.
For example, 83% of the time Bitcoin moved in the same direction as liquidity (M2).
The S&P 500 (US stock market) came in second place, and it was also very correlated with the money supply, at 81%.
Global markets (VT), gold, and emerging market (EEM) indices show some responsiveness, with bond markets (TLT and BND) showing less consistent correlation.
The results are pretty clear, but the challenge is in implementation.
Later this week, I’ll share more about how you can set up a smart and easy-to-implement ‘liquidity trade’ strategy.
Regards,
 |
Ryan Dinse,
Editor, Crypto Capital and Alpha Tech Trader


Comments