
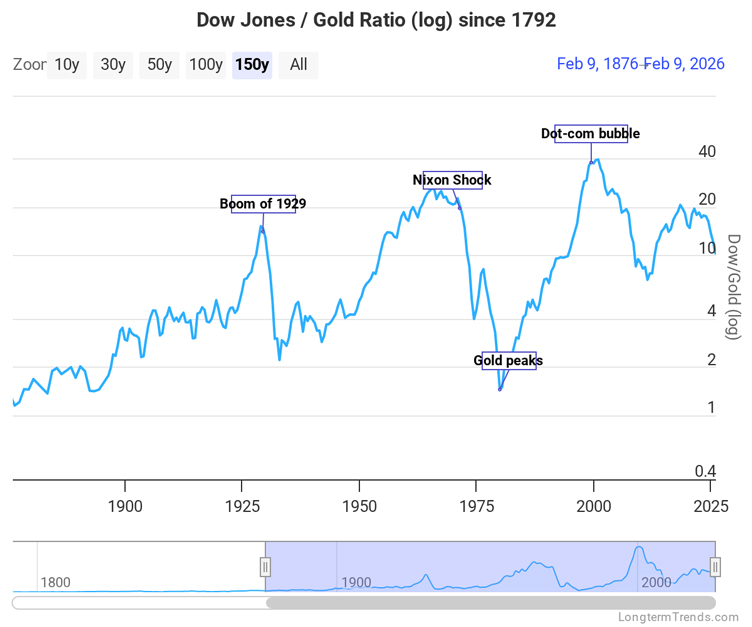
Dow/Gold ratio going back 150 years. Source: LongtermTrends.com
We took a very gray, very rainy ferry ride over to France last night.
Fortunately, there wasn’t much wind. This time of year, the sea can be rough. But last night, Neptune went easy on us. We dined and slept comfortably.
For no particular reason, other than curiosity, let’s turn to gold. We’ve had it stocked up in our hidey-holes for more than two decades. Mostly, we ignored it and it ignored us.
Which was fine. You make your money by buying the right thing at the right time…and then by ignoring its ups and downs, sticking with the strategy until it finally pays off…or not.
But lately, gold has sparkled so brightly, we couldn’t keep our eyes off of it. A chart of the gold price showed such an upward leap that we were sure the yellow metal would fall on its face. It was a ‘sell’ signal; we could scarcely mistake it.
That said, the gold price never hit our ‘magic’ number. For the benefit of new readers, if there are any, the magic number is five. Halfway between nothing and double digits…it’s a crooked little digit that can’t seem to decide whether it is rational (with its straight stem and right angle handle) or baroque (with its Bolshevik sickle swinging down below it).
Why five? Why not six or seven?
The answer to that question is proprietary. But we’ll tell you anyway. Late at night, after a bottle of Malbec, we looked at an historic chart of the Dow priced in ounces of gold. We had already determined that the two things — America’s greatest corporations and the price of gold — tended to go up and down in broad, long, mutually opposed cycles.
We also knew that real wealth is made by businesses. It’s the difference between what it costs to provide a product or a service, and what people will willingly pay for it (what it is really worth). ‘Profit’ is what they call it…and it’s the only genuine new wealth in the whole economy. Everything else is zero sum, with prices moving up and down, making some people richer and some poorer. You can discover the Mother Lode and the world would not be one penny richer; it would just have more money.
So, if you wanted to make money safely, you’d own profit making companies. Better yet, buy them when they were cheap and sell them when they were dear. But how would you know when they were cheap? You check the price in real money, gold!
Studying the chart more carefully, and using a trailing stop loss to prevent selling too soon, it looked like five ounces to the Dow was a ratio we could work with. Five ounces of gold per the entire group of 30 Dow stocks would mark a ‘bottom’ for the stock market, triggering our ‘buy stocks’ signal.
Is that number too high? Too low?
It may be asking for too much of a bargain. The last time you could get the Dow for just five ounces of gold was in 1988 — 38 years ago. If you’d bought stocks then, and just held on, you would have multiplied your capital by 25.
Or, if you’d followed our model, you would have multiplied your capital by only three, until 1996. Our system gets you in at 5 but out (of stocks) at 15. It sounds like a loser, until you realize that your gold — where you’ve been resting comfortably since 1996 — has gone up 13 times. So if you began with five ounces of gold (about $2,000)… bought stocks in 1988 and stayed put…you would have gotten the full 25x gain, equal to today’s Dow value, say, $50,000. But if you sold out of stocks in 1996, in exchange for gold, you would now own 15 ounces of gold which would be worth (not counting dividends or trailing stops) $75,000.
Are you still with us?
Whether that will repeat itself going forward, your guess is as good as ours.
But that’s why we didn’t give a big ‘sell gold’ signal even as the price shot up over $5,000 an ounce.
As it turned out, there was a sharp correction last week. But now that the price is back over $5,000 the question has returned too: Is gold too expensive? Is it time to sell? How does the gold price compare to other things of real value?
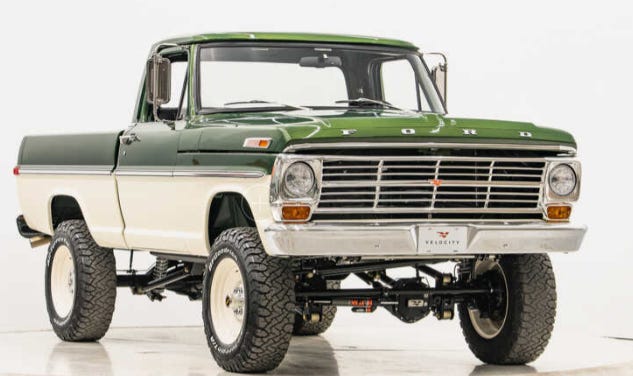
1971 Ford F-150
Often, in these pages, we have referred to a workingman’s wheels — the Ford F-150 pickup — as a basic value. You could buy one in 1971 for $1,200. The price of gold was $43. So, it took 27 ounces to buy it.
Today, you can pick up a new F-150 for $40,000. Or, only 8 ounces. Is gold too high? Is the truck too low?
Let’s look at housing. In 1971, the average new house sold for $28,000…or 650 ounces of gold! If you want new digs today, however, you’ll have to pay $460,000…or only 92 ounces. Houses are much less expensive in gold terms, but much more expensive in dollars.
Meanwhile, the price of farmland, today, is said to be about $5,000, according the Department of Agriculture. And if you look at an historic chart you see that farmland has generally, from 1971 to today, kept even with gold. One to one.
What does all this mean? Tom points out that we have made money ‘for the wrong reasons.’ We expected to get to our ‘magic 5 ratio’ by reversion to the mean. Gold would go up steadily while stocks crashed. That hasn’t happened, yet. Instead, stocks were the turtle; gold was the hare. And which to bet on now? We don’t know.
“You kin make a fine stew wi’ eder of dem,” Uncle Remus might say.
But we don’t know what that has to do with it either.
So, we’ll stick with five.
Regards,

Bill Bonner,
For Fat Tail Daily

Comments