
Trump is on stage giving a State of the Union address as I write this.
I’m not really paying attention.
I’m watching commodities charts right now.
Lithium’s having a strong day, in fact, it’s mostly a sea of green right now.
Meanwhile, the Wall St ‘AI scare trade’ appears to be shaken off for the moment.
The S&P 500 and NASDAQ remain brushed up against all-time highs.
I’ve said before, these all-time highs are often meaningless narratives in the face of inflation-adjusted money supply.
Or perhaps more rightly, what Michael Howell’s excellent Capital Wars describes as global liquidity.
Here’s a chart of Howell’s below, which I shared with my paid-service members. It shows liquidity beginning to ebb.
Meaning the money that powers Wall St’s wins is starting to dry up.
And that really got me thinking:
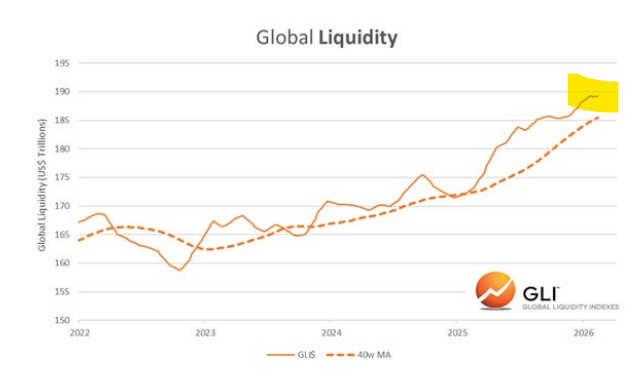
Source: Capital Wars
Global liquidity for Howell is a broad measure of all the money sloshing around the whole financial system, including all the less scrutinised efforts of central bankers working the money pumps.
That yellow bit top right?
A potential peak that is really worth paying attention to.
If that stays level or declines, expect major indices like the S&P 500 and NDQ to be dragged lower.
In the East, China has been adding to global liquidity with near-relentless cuts of its Reserve Requirement Ratio:
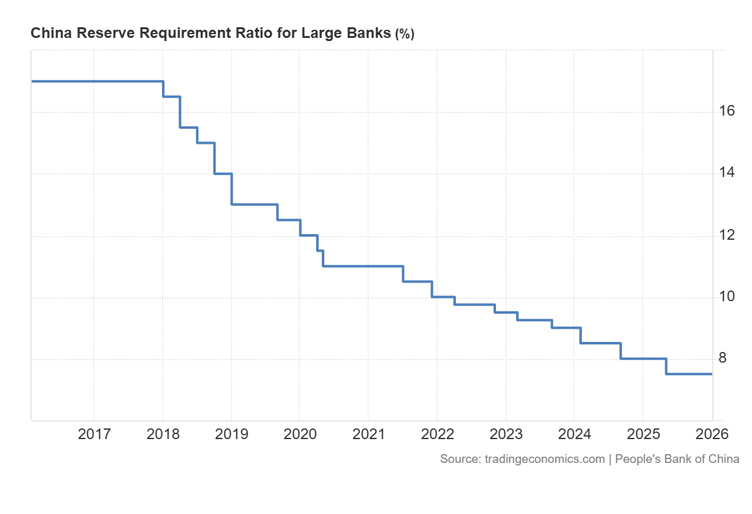
Source: Tradingcommodities.com
[Click to open in a new window]
This is roughly a measure of how much cash large banks in China need to keep on hand.
China is feeling the pinch too — something my colleague Brian Chu at The Daily Reckoning has been detailing to readers.
What does this all add up to?
Something might have to break
If the new US Fed chair doesn’t hand out the lollies and give Wall St what it wants (a big rate cut), the top end of the market could throw a pretty nasty tantrum.
Don’t let that panic set in for you, though.
I think if those indexes fall hard, that will be the catalyst for a much bigger push by the market into commodities than we’ve seen so far.
Commodities are a traditional hedge against inflation, remember.
And when that inflation hedge bid gets supercharged by massive demand emanating from the AI data build out…
You might see where I’m going with this?
What this means for ASX investors
I think this means that there is still time to position in commodities if you have the risk appetite.
I’ve released a new special report called Pax Silica, which details how I think AI and commodities are converging (and the specific stocks I’ve selected to benefit).
Regards,

Lachlann Tierney,
Australian Small-Cap Investigator and Fat Tail Microcaps
***
Murray’s Chart of the Day – Financials vs Metals & Mining
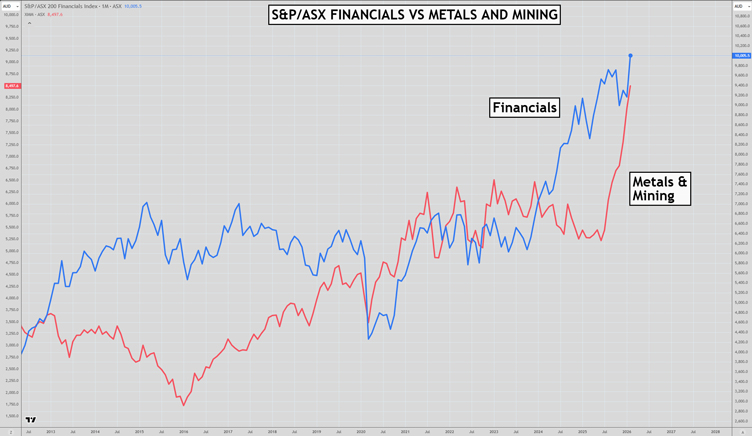
Source: TradingvVew
We are witnessing some immense volatility in stocks at the moment as software stocks crash, and recent earnings releases cause large gaps up or down in the price of many stocks.
But the S&P/ASX 200 index [ASX:XJO] just keeps chugging on. As it retests the all-time high this week, you don’t have to go far to see why the index is rock solid.
It isn’t often that the S&P/ASX Financials [ASX:XFJ] and S&P/ASX Metals and Mining [ASX:XMM] indices are sharply trending higher together at the same time.
The banks released solid results recently which has seen their rally of the last year go up another notch. BHP Group [ASX:BHP] and RIO Tinto [ASX:RIO] have broken out to new all-time highs after years going sideways and are screaming higher.
The big four banks combined with BHP and RIO make up an astonishing 43% of the market cap of the ASX 200.
When 43% of the market is rapidly flying higher, it’s no wonder the overall index looks so good, despite the turmoil under the surface.
Regards,

Murray Dawes,
Retirement Trader, International Stock Trader and
Murray’s Trading Room

Comments