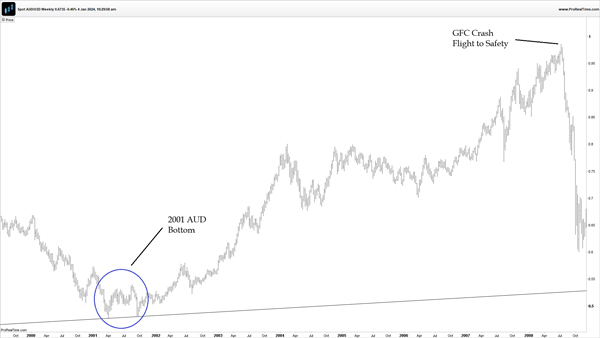
Step back to 2001, and the Australian dollar traded for just 47 cents against the US dollar!
That was a terrible time to be travelling in the States.
But that would mark a MAJOR bottom, which would precede a gigantic surge in the AUD.
Thanks to China’s infrastructure boom, the Aussie catapulted its way to an all-time high of 98 cents in July 2008.
An incredible trough-to-peak move of more than 100% in just seven years…
| |
| Source: ProRealTime |
That was a major move for a currency.
And it was largely thanks to Australia’s surging terms of trade, driven by rising commodity prices.
But the 2008 Global Financial Crisis briefly ended the ecstatic rise…
In a flight to safety, investors fled the AUD and moved assets into treasuries and US cash.
But what the chart above doesn’t show is the rapid recovery that followed the 2008 panic.
With the China-led boom rolling on, the Australian dollar did the unthinkable a few years later…
It surpassed the value of the world’s most important currency and reached an all-time high of $1.11.
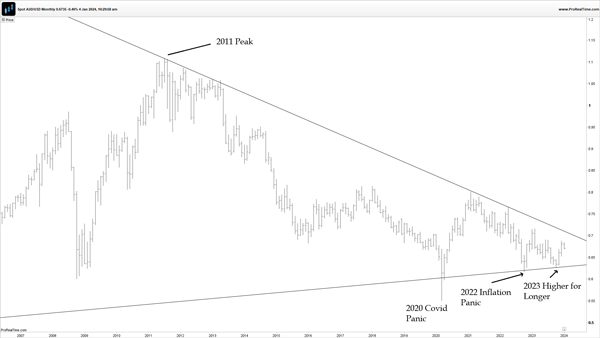
But since those glorious highs, it’s been mostly downhill for the AUD.
With its strong leverage to commodities, the Aussie dollar has steadily declined into a decade-long downtrend.
That culminated during the pandemic-led panic of March 2020…
Where another ‘flight to safety’ event drove investors AWAY from the Aussie dollar.
From its glorious peak in 2011, the Australian dollar fell to a decade low of just 55 cents in 2020.
Is history repeating?
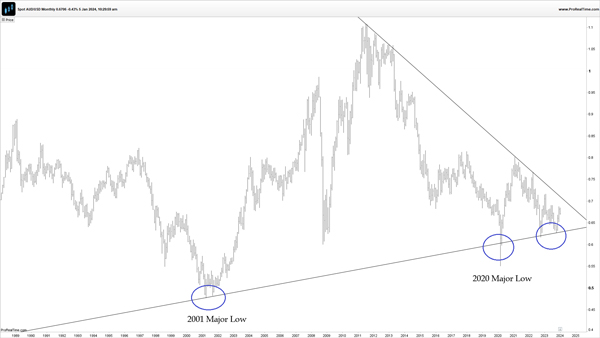
In many ways, the bottom of 2020 resembles the lows of 2001.
Australia’s most important export market (mining) had lain dormant for years.
A sector shunned by investors focused heavily on tech stocks.
But the need to invest in tangible assets began to RISE after 2020, just as it did in 2001.
Both periods were preceded by a MAJOR global shock…
In 2001, it was the threat of terrorism.
In 2020, it was the fear of a rapidly spreading virus.
Different CAUSES but similar outcomes…approximately 20 years apart.
If we use the last cycle as a guide, we could have some clues as to what comes next for mining…
2001 was followed by a strengthening AUD, alongside rising activity in the mining industry.
Similarly, in 2020 we’ve seen emerging strength across commodity markets.
That includes gold which now sits just below its all-time highs.
But does recent strength align with a rising AUD, as it did in the early stages of the 2000s commodity boom?
You’d be forgiven for thinking that the AUD has had a terrible run over the last couple of years.
Much of the narrative in financial circles has focused on major strength in the USD.
So, you might be surprised to see the AUD has actually trended up against the greenback over the past two years!
Take a look for yourself below…
| |
| Source: ProRealTime |
A sequence of ‘higher lows’ against a backdrop of several market panics…
There was the 2022 inflation panic causing markets to bottom mid-way through 2022.
We also witnessed a major sell-off in October 2023 as the US Fed pushed its ‘higher-for-longer’ narrative onto global markets.
Both events sparked downward pressure on the AUD.
However, neither event pushed the AUD anywhere close to the pandemic lows of 2020.
So, why’s that important?
For the first time in more than a decade, the AUD is displaying ‘technical’ strength against the greenback.
That’s despite record breaking rate rises in the US.
What this could mean for an emerging bull market in commodities
Commodities are a multi-faceted beast, incorporating energy, food, and minerals.
That makes them incredibly difficult to track as a package.
Each commodity is influenced by its own supply and demand factors.
But when we talk about a ‘super cycle’, we typically mean a broad rise across the full spectrum of metals, energy, and food commodities.
And that can be very difficult to recognise in real time.
While some commodities surge, others could be falling.
Broadly though, we’d expect the full package of commodities to be trending higher.
With Australia’s economy remaining highly leveraged this sector, its currency offers a yard stick as to the broad direction of resources.
And, in my mind, the AUD chart below is showing early signs of strength…
| |
| Source: ProRealTime |
And there’s plenty of anecdotal evidence that backs this up…
Take Australia’s mining hub, Perth.
Property price growth here is now the fastest in the country.
In fact, Perth property has followed a similar path to the AUD over the last decade, falling in the wake of declining commodity prices.
Yet, that trend has shifted over the last two years.
Similarly, vacancy rates in Western Australia’s capital are at record-low levels.
Australia’s mining capital is buzzing.
According to Geoscience Australia, 2021 saw record levels of drilling, surpassing the peak from the last mining boom.
No doubt, conditions are heating up in Australia’s mining industry.
So, how far could this go?
Given the AUD traded as high as $1.11 during the last mining boom suggests there’s plenty of room for growth.
That AUD currently hovers BELOW 70 cents.
A rising Aussie dollar could be a major theme in the years to come…keep it on your radar!
This is another important tool in the resource investor’s kit.
Until next time,
 |
James Cooper,
Editor, Fat Tail Daily


Comments