
With the ASX on course to shed nearly 2% today, let’s take a look at what could happen with the stock markets…
Second wave fears are growing, and the situation in the state of Victoria is definitely a concern.
The AFR this morning carried some quotes from AMP’s chief economist Shane Oliver, who says Friday’s rally is just the beginning:
‘I suspect it’s going to be another rough week. Last week our market fell only slightly… but I expect as long as these concerns remain about second waves we’re going to see continued volatility in the share market and maybe some more weakness in the week ahead.’
So apparently, it’s all going to go pear-shaped.
This is not a time to panic. It’s a time for ACTION. Click here to download your free report now.
I’ve marked out some levels on the ASX 200 [XJO] below, which correspond to potential support dating back to 2017 and 2019:
|
|
| Source: tradingview.com |
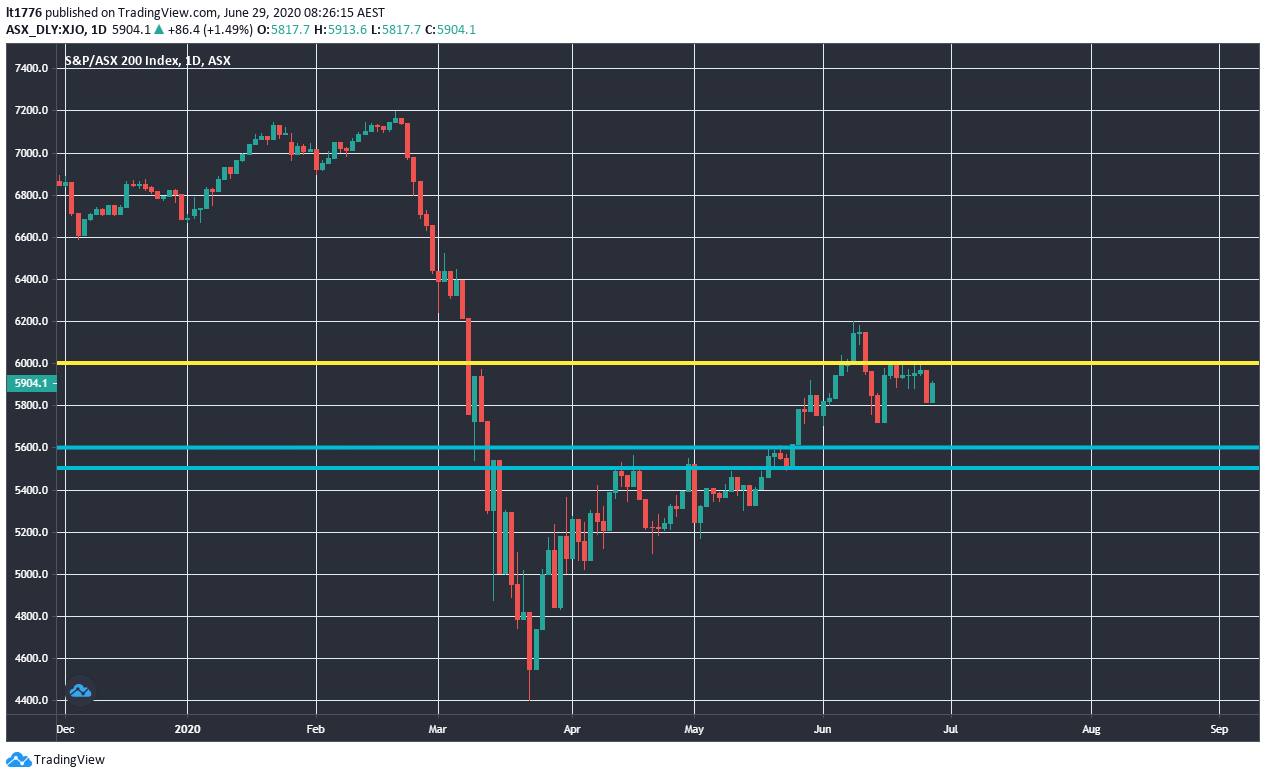
As you can see [XJO] ran into some resistance (yellow line) at 6,000, and the two lines below that mark some levels at which buying may creep in.
These are 5,600 and 5,500.
This would correspond to a loss of 6.66% and 8.33%.
It could even push past this toward 5,400 in a truly negative scenario.
That is, if the bad news continues to roll in throughout the week.
But what of the S&P/ASX Small Ordinaries Index [XSO], the oft forgotten about cousin of [XJO]?
This is the index which includes companies in the S&P/ASX 300 Index, but not in the S&P/ASX 100 Index.
As you can see it fell in lockstep with [XJO] to the March lows, but experienced a stronger run-up in the aftermath of the crash:
|
|
| Source: tradingview.com |
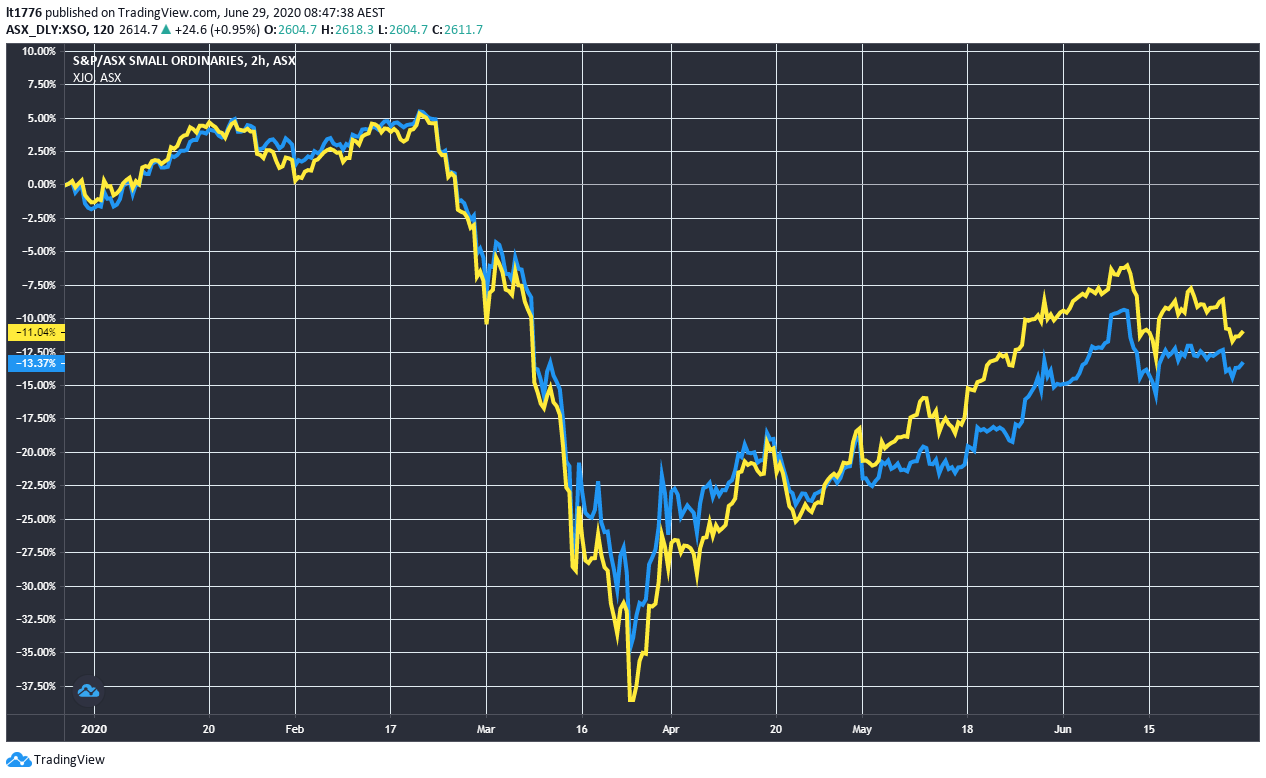
In a six-month window [XSO] lost 11%, while [XJO] lost 13%.
Smaller, potentially riskier, and potentially more rewarding companies were favoured as the market rebounded.
This isn’t surprising.
[conversion type=”in_post”]
Here are two scenarios to consider though:
Scenario #1: Sideways for years
Scenario #2: Edging down for a year or 1.5 years
I base these two potential scenarios on what the ASX 200 did in 1987–93 and 2008–10.
Have a look at the last two major crashes in the context of the monthly chart for the ASX 200, dating back to 1986:
|
|
| Source: tradingview.com |
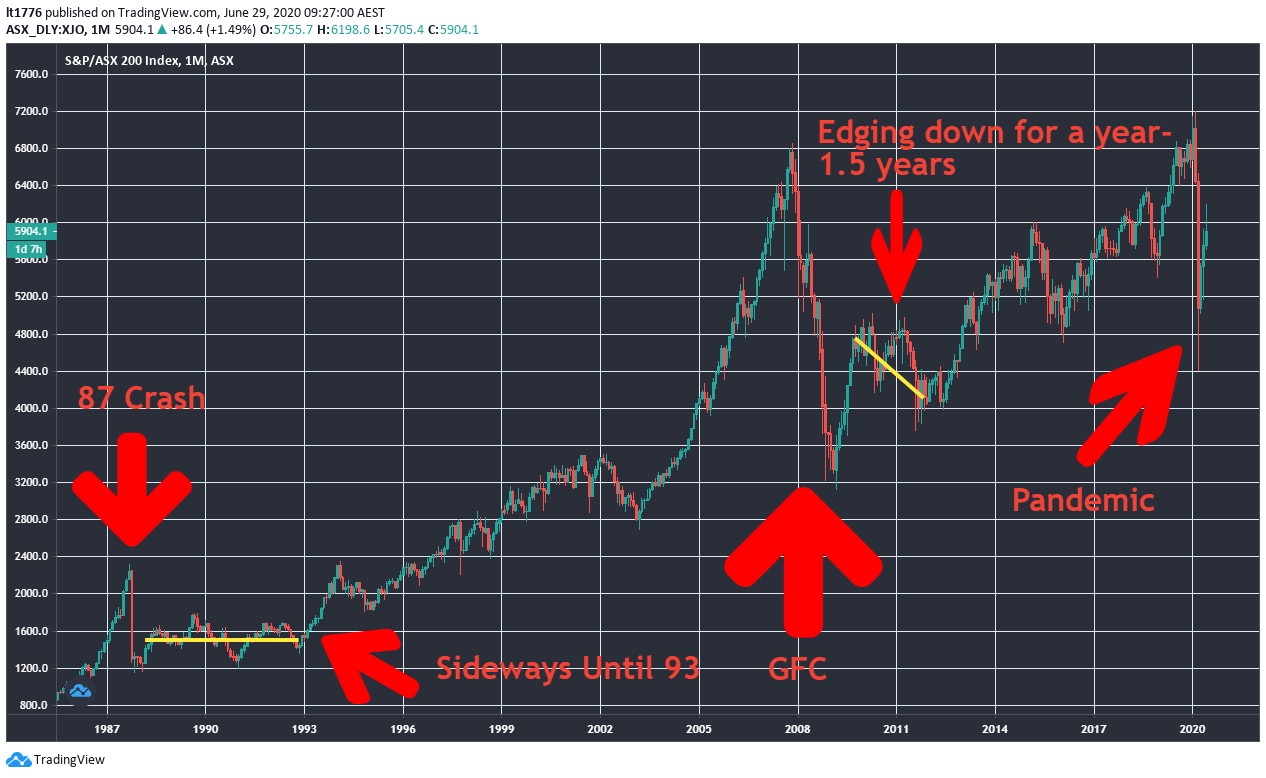
In 1987, after losing 41.8% by the end of October, the ASX 200 took ages to get back into the swing of things.
It wound up trading largely sideways until 1993.
In 2008–10, things were a bit different.
After a strong bounce back at the start of 2009, it wound up edging down for a bit over a year and a half.
Now, which of the two scenarios will it be?
I think the bounce back from the March lows more closely resembles the GFC bounce back than what happened in the aftermath of the 1987 crash.
Afterall, the response from central banks and governments is very much the same as what they did during the GFC.
Pulling a page from the same playbook, they are unleashing an avalanche of cheap money to prop up debt-funded growth.
Which means what happens this week could be the start of a longer slide.
The good news?
If this scenario plays out, it could be a shorter time before the market starts its charge upwards.
Now, as for the question of what to do in this period of a year to 1.5 years…
I think the most important thing to bear in mind is that if a slide is on the cards, betting on the index won’t help.
You’d need to hold your ASX 200 ETF during the slide.
A lot of this comes down to distributions.
Meaning, there will be a distribution of how companies respond to the crisis.
|
|
| Source: Calcworkshop.com |
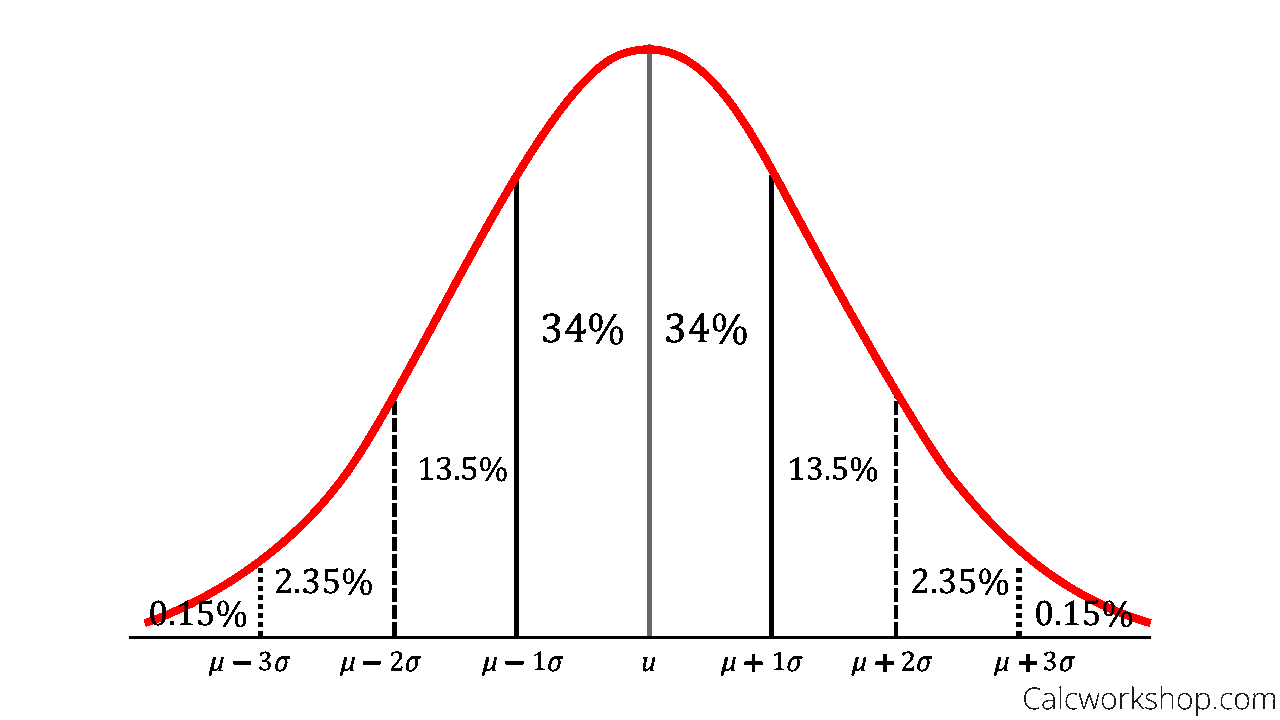
There will be companies that go bust, companies that flounder, companies that take a hit, companies that do better than others, companies that do really well, and a really small percentage may go vertical.
If you have an ASX 200 ETF though, you must take the good with the bad.
So being selective is now really important.
What industries or specific types of companies are likely to benefit from this environment?
I’ll take a deeper dive into this question on Wednesday, but we’ve already seen some major winners.
Especially in e-commerce, for example.
The Kogan.com Ltd [ASX:KGN] share price is just off all-time highs and up more than 200% in a 12-month window.
It just goes to show you what kind of returns you could be looking at if you turn off autopilot and put on your thinking cap.
Now more than ever, it could pay to be discerning.
Regards,
Lachlann Tierney,
For Money Morning
Lachlann is also the Junior Analyst at Exponential Stock Investor, a stock tipping newsletter that hunts for promising small-cap stocks. For information on how to subscribe and see what Lachy’s telling subscribers right now, please click here.

Comments