
Today, I’ve a number of recent data points from around the world for you to consider.
Fair warning, it’s all a bit strange!
And there’s a twist to these contradictory numbers.
As I’ll show you at the end, if you don’t get this one underlying fact right, you’re reading everything else wrong.
With that said, let’s start in Japan…
The bad news?
The world’s third largest economy entered a technical recession last Thursday.
That’s defined as two quarters of consecutive negative growth.
Japan was joined by the UK — the world’s fifth largest economy — which also went into a recession last week.
The silver lining?
In the very same week, the Japanese stock market — the Nikkei — closed at a 34-year high!
It’s now within striking distance of levels not seen since the heady days of the 1980’s.
It was a similar story for the UK stock market.
The FTSE 100 also had its best day of the year on Thursday. The index of top UK stock finished up 1.5%, despite the recession news.
How about the big dog of markets, the US?
There was some strange stories playing out here too.
Earlier in the week, inflation data came in hot resulting in a sharp drop in markets — the biggest one day drop since March 2023.
The thinking was that deep interest cuts were off the table once more.
However the very next day, weaker than expected retail spending data saw markets bounce back.
Rate cuts were now back on the table, it seemed! And the S&P 500 clawed back its losses to finish back at record highs.
Here in Australia the unemployment rate jumped sharply higher, hitting 4.1%. This is the highest level in two years.
Does that mean markets are going to go higher then?
It’s all a bit strange at face value.
Good news is bad news, bad news is good news!
Or so it seems…
It’s the Currency, Stupid.
There’s so much conflicting economic data, it’s almost impossible to work out what happens next.
Every outcome — from a 1929-style meltdown, through to a face melting AI-driven rally — is on the table.
But the simplest answer seems to be based on what central banks do next.
That’s pretty much all the market is trading right now.
Remember the market is forward looking and starts to price things in it sees six or so months out.
So when you see countries going into recession, the market is starting to price in the response of central bankers — interest cuts, quantitative easing, and other such monetary tricks — that’ll be used to get to the other side.
In frank terms, the market is pricing in a further debasement of the world’s fiat currencies.
To paraphrase Bill Clinton, ‘it’s the currency, stupid!’
When money become worth less, assets like stocks and property become worth more.
If you think about it, it makes sense…
I mean, if your groceries are costing more, your electricity bill is surging, and the cost of life is generally going up, there’s always someone (or some company) on the other side of that trade collecting the higher amount.
It doesn’t mean that counterparty is always profiting more — despite the political hoopla around ‘price gouging’ right now — as their own input costs will be rising too.
But if they have some pricing power, they will increase their sticker prices to cover inflation costs.
Every company on the stock market attempts to do this, which in turn makes it a good place to put your money as an inflation protected asset.
For an extreme example of this in action, see the behaviour of the German stock market during the hyperinflation years of the Weimar Republic in the early 1920s.
| |
| Source: Investment Moats |
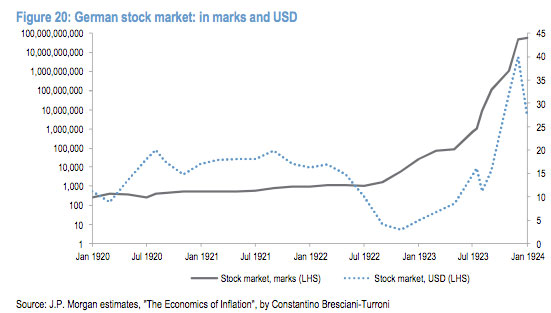
The black line shows the level of the stock market priced in German currency.
And the dotted blue line shows the level of the stock market priced in US dollars.
As you can see the stock market provided good protection in nominal terms (German marks) for Germans but not quite as good in real terms (US dollars) which saw some wild fluctuations.
Which brings me back to some of the data points at the start…
Adjusting for Reality
Right now, the Japanese market may be close to all time highs in nominal terms (Yen).
But how about in ‘real’ terms?
Well, when you price the Japanese market in term of US dollars — as the global reserve currency this is a truer reflection of its value — you get a very different story.
Check out the exchange rate of the US dollar to the Japanese Yen:
| |
| Source: xe.com |
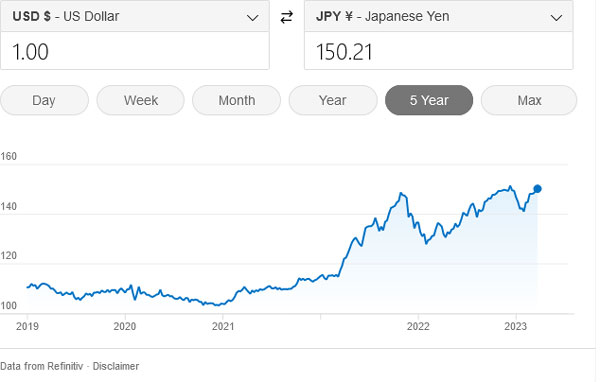
This chart shows you the Yen has fallen by almost 50% in value against the US dollar in just three years.
This means, adjusting for the fall in the Yen’s value the Japanese market is still well short of all-time highs.
We can do this exercise using a number of different monetary assets.
For example, priced in gold, the Japanese Yen is worth 52% less than it was five years ago.
[Editor’s note: My go-to-man on gold, Brian Chu, is doing a presentation this week on why he thinks a surge in the price of gold is imminent. Looking at his track record over the gold cycle, there should be some very interesting insights on this and what stock to buy. Click here to reserve your spot.]
In short, the Japanese stock market is down a lot when priced in gold terms too.
But not as much as it is priced in this…
My favourite monetary asset, Bitcoin [BTC], is up 58% against the Japanese Yen in just the past year.
Over five years it’s up a staggering 94.8%.
In other words, the Japanese stock market is down massively when your base monetary asset is Bitcoin.
What you price your wealth in matters.
And the implications of this are especially profound for investors living through an era of extreme currency debasement.
Like we are now.
To get the true value of any asset you need to adjust for the devaluation of that currency.
If you’re a believer in the current system, that means repricing everything in US dollar terms.
If you’re a believer in gold as money — the system that existed for thousands of years before — then you need to adjust asset values for the gold price.
And if like me you’re a believer in this new era of digital gold — Bitcoin — you need to adjust everything for the immense rise in Bitcoin’s purchasing power.
If you don’t you may as well measure your wealth in Monopoly money!
A last point…
Demand for Bitcoin ETFs Proves Insatiable
It’s been 25 days since 10 new Bitcoin spot ETFs were approved.
And so far, the results have been astounding.
Bitcoin ETFs have already US$37 billion in funds under management.
For comparison it took gold ETF’s — which launched in 2004 — 7,030 days to reach US$93 billion.
In other words, BTC ETFs are growing at a rate of 40.2x the rate of gold ETF’s.
But get this…
Even gold’s relatively sluggish ETF demand kickstarted an 8-year bull run in the price of gold as you can see here (gold priced in yellow):
| |
| Source: Business Insider |
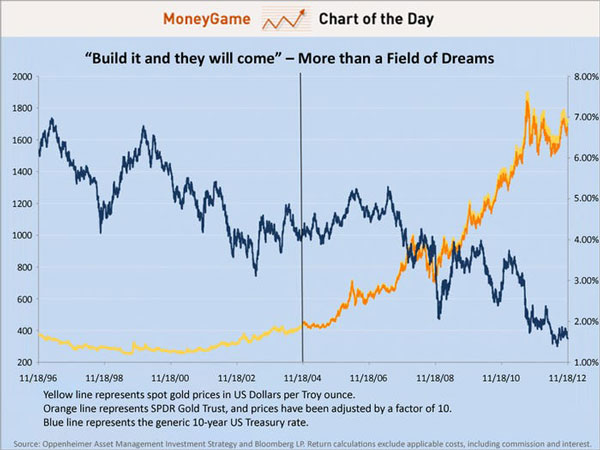
The blue line shows is US interest rates and you can see the inverse correlation to the gold price.
Now let me ask you this…
What do you think a monetary asset with 40x the demand of gold is going to do when central banks start cutting rates in the face of rising unemployment and a global recession?
I know the outcome I’m betting on…
Good investing,
 |
Ryan Dinse,
Editor, Crypto Capital, and Alpha Tech Trader

Comments