The latest CoreLogic Home Value Index came out yesterday.
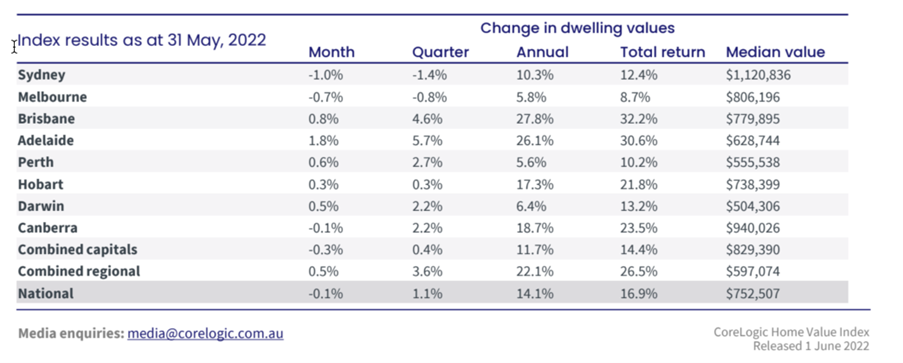
Headlining the results is the revelation that we’ve had the first national fall (-0.3%) in median dwelling values since September 2020.
Sydney, the most expensive capital, is leading the way.
It’s down 1.0% over the month of May.
To put this in context, Sydney housing values have fallen 1.5% since the beginning of the year.
Still, they remain 22.7% above pre-COVID levels. Owners are a long way from being underwater.
Due to affordability constraints, Sydney tends to peak ahead of the other capitals in the real estate cycle.
It did so back in 2004, with median values plateauing into 2008. So nothing is surprising or unexpected with this trend.
Canberra (Australia’s second most expensive property market) also fell over May, down 0.1%.
The market in the nation’s capital has had almost three years of solid growth.
There was a strong increase of 2.2% in the three months to May.
So a pullback in the lead up to the election isn’t necessarily telling of a solid change in trend.
This is despite former treasurer Joe Hockey’s advice back in 2018:
‘There is a golden rule for real estate in Canberra — you buy Liberal and you sell Labor.’
Melbourne tells a similar story. Values fell 0.7% in May.
The market has been slowing in Melbourne since late last year.
The population exodus out of the metro area, coupled with an uptick in the number of homes hitting the market, is the prime cause.
However, there are potentially signs of revival:
|
|
|
Source: Twitter |
There’s a lot of huff and puff about the accuracy of auction results.
But whichever data agency you follow (SQM being the most accurate and diligent in chasing up all missing results), changes in the percentage are a leading indicator for changes in both median price and trend.
So the clearance rate is worth keeping an eye on.
The other capitals are gaining, although at a slower pace than previously. That’s also the case for the regional markets.
Here’s the breakdown — monthly, quarterly, and annual results by Capital:
|
|
|
Source: CoreLogic |
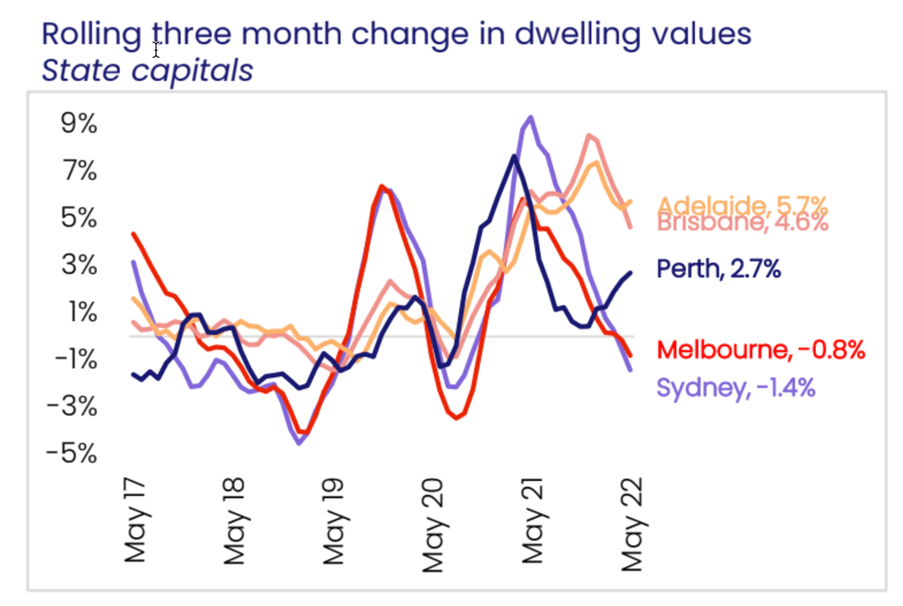
The positive news comes out of Adelaide and Perth.
Both states have shown an increase in their quarterly growth rates:
|
|
|
Source: CoreLogic |
I mentioned both capitals in The Daily Reckoning Australia about a month or so ago.
The vacancy rates (VR) are at record lows.
In Adelaide, according to Domain, the VR is 0.2% — the lowest in any capital since they started collecting results!
In Perth, there are reports of animal shelters being inundated with pets. Landlords in Perth unwilling to accommodate tenants with cats and dogs.
There’s also been a strong increase in the number of homeless in the CBD — up at least 35% since September last year.
The rental crisis is not forecast to end any time soon.
Interest rates have not dampened the market in Perth.
Agents I speak to on the ground tell me that ‘green title’ homes (the common name given to detached housing on a traditional block of land in WA) are attracting strong demand.
Numbers of buyers going through open-for-inspections has increased over the last few months.
Perth property sales are at levels not seen since 2010.
Housing in the state looks cheap to buyers on the east coast, some 25–30% lower than Brisbane and Melbourne.
There’s more supply than demand for both properties for sale and properties for rent.
On the back of the mining boom, the state has the strongest economy, with the unemployment rate sitting at a 14-year low.
Sounds like a perfect storm to me.
There’s a potential boom ahead for WA’s property market.
I forecast all this back in 2019 to my subscribers over at Cycles, Trends & Forecasts.
Those that acted on the advice in 2020 will have gained over the COVID years and are in a solid position to advantage into 2026.
If you want more information on how you can gain from knowing when the real estate market is going to turn years in advance, you can find out more here!
Best wishes,
 |
Catherine Cashmore,
Editor, The Daily Reckoning Australia


