
Many want to know how to time and sell at the top of the real estate cycle, which, over at Cycles, Trends & Forecasts, we have forecast to occur in 2026.
This is not an easy task.
More so because the median peak in property values differs per state and territory.
And note, you don’t have to sell at the top!
As I’ve stressed previously, history shows that good real estate — in the biggest states by population (primarily Sydney and Melbourne) — typically exceeds the peak of the cycle in the first half of the next cycle…prior to the following mid-cycle downturn.
More on that another time.
Note also, that the Australian property market has not always chimed to a regular boom/bust 18-year pattern either.
The economic downturns at the end of the 18.6-year cycle have been muted in periods when there was minimal speculation on property.
Put simply: If there isn’t a boom in land values, there won’t be a bust.
Furthermore, for many years in Australia’s early history, we had policies to prevent speculation on land (federal land taxes, rent control, and so forth).
This resulted in long periods of land price stagnation.
When speculation did occur, however, the crash in land values aligned with the 18-year cycle and the downturns were typically harsh.
The 1840s and early 1890s downturns are a good example.
Both came at the end of the 18.6-year cycle and fell in alignment with the boom/bust pattern led by the US.
In fact, the 1890s downturn outdid them all.
Data shows that from 1887 to the peak in 1891, housing prices increased by 32%, only to collapse by another 31% over the next half a decade.
We missed the next cycle due to it.
Prices remained stagnant until the early 1920s.
- They lifted 25% in the lead-up to the Great Depression, only to fall by 26% in the downturn that followed.
In recent cycles, the end-of-cycle downturns have been equally devastating.
- House prices increased by 70% from 1961 to the peak of the 18-year cycle in 1974, then fell by 16% by 1979.
Agents reported a 75% failure rate in achieving sales of houses on their books.
Approvals for new private dwellings fell by 7.9%.
In September 1974, multiple commercial property developers went into receivership. Eight major development projects, valued at $135 million, were abandoned.
There was a run on some building societies, and state governments were forced to give guarantees of support for financial institutions.
- The 1990s downturn also had a prolonged effect on the residential property market, with values taking around 5–7 years to recover to their previous peak.
This differed by state and territory — with the decline being worse in Sydney and Melbourne.
Commercial median property values fell more than 50% in some parts of the country, with prices collapsing by around 60% in real terms and by around 70% in Perth.
- The GFC in 2008 was a milder downturn, mainly due to government intervention and a strong mining boom.
However, it wasn’t an easy time for the sector!
Property values were hammered in some areas, with certain regions experiencing double-digit percentage declines.
There was a sharp increase in mortgage defaults and foreclosures across the country, and many construction companies fell into bankruptcy.
And let’s not forget; each downturn has been accompanied by a significant stock market crash leading to severe economic recession.
- 1974 October Crash.
The Dow Jones Industrial Average fell by more than 45% from its peak in January 1973 to its bottom in December 1974.
- 1987 Black Monday crash.
The Dow Jones Industrial Average plummeted by 22.6%. It was the largest single-day percentage drop in the history of the US stock market.
- And September 2008.
The Dow Jones Industrial Average experienced a decline of 777.68 points — a 6.98% drop.
We’ll be looking for the same in 2026–27.
Also, because prices didn’t deleverage significantly in 2008, I would speculate there’s a very real probability that the downturn at the end of this cycle will be harsh.
You need to be prepared for it.
And one thing to factor in is the public’s mentality towards the property market.
It’s been a long time since Australia experienced a property crash on the same scale as the US and UK in 2008.
Most are confident it won’t happen.
After all, if COVID, rocketing inflation, and the fastest/highest interest rate hiking cycle in recent history didn’t do it, what could?
Equally, most have no memory of the 1970s and 1990s downturns.
In truth, severe economic downturns — such as what we see at the end of a cycle — never come when people are expecting it.
They’re unforeseen black swan events — experienced at times when skies look blue and confidence is high.
The key is to know how to ride the boom and hedge against the bust. That’s what we teach subscribers to do over at Cycles, Trends & Forecasts.
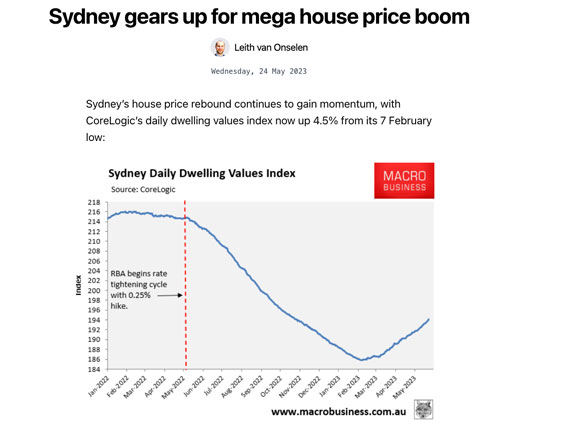
Right now, we’re past the bottom of the 2022 slump.
The national median price fell 9.1% between May 2022 and February 2023.
Since then, it has been on an upward trajectory. Increasing by 0.6% in March and 0.5% in April.
But there’s also reason to believe that the trend will accelerate as we move toward 2024, with Sydney leading the way.
|
|
| Source: Macrobusiness |
This is not just wishful thinking; it’s grounded in concrete factors.
- An unprecedented wave of immigration. 715,000 net overseas migrants are officially projected to land in Australia in 2023–24.
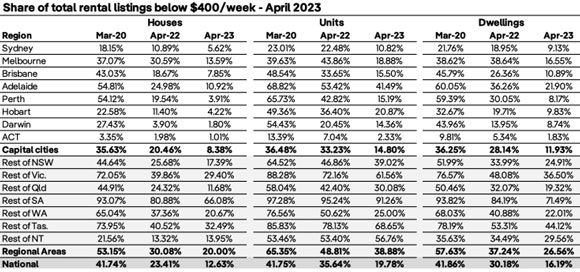
- Record-breaking low vacancy rates that will continue to push rents higher.
In fact, According to PropTrack, the percentage of properties listed for rent on realestate.com.au at a rate of less than $400 per week hit a record low of 16.2% in April.
It’s a significant decline compared to a year ago, when 30.2% of rental listings fell within that price range:
‘The nation’s rental market is in dire straits, with little sign of meaningful reprieve on the horizon
‘Advertised rents are recording strong price increases and vacancies are at historic lows amid a shortage of rental supply.
‘Strong demand, bolstered by rising immigration, is outstripping the supply of available rentals.
‘As a result, the cost of renting is climbing and the share of rental listings below $400 is set to remain low’.
|
|
| Source: PropTrack |
Additionally, we have non-bank lenders contemplating removing or slashing the APRA serviceability buffer to assist buyers in the market.
Westpac has also recently announced it would allow some people looking to refinance their mortgage to be tested under a ‘modified Serviceability Assessment Rate’ if they do not pass the standard serviceability test.
The first home buyer scheme has been extended to allow friends and siblings to access the benefits — potentially opening the door for tens of thousands of new entrants to compete in the market over the next few years.
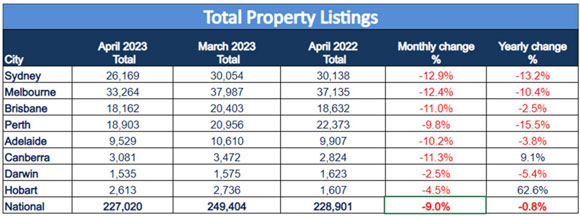
And new listings remain tight — with SQM Research’s ‘Stock on Market’ report for April showing total listings experienced a month-on-month decline of 9% and a year-on-year decrease of 0.8%.
The most significant impacts are observed in Sydney and Melbourne, coinciding with a marked increase in net overseas migration in those areas.
|
|
| Source: SQM |
By the time we get to 2026, should history repeat, the cycle will be roaring.
No one will expect the downturn that will take us into a 2028 recession/depression.
Few will know how to protect themselves from the devastation.
Our expert analysis at Cycles, Trends & Forecasts equips you with the secret strategies to navigate the markets through this period.
Advantage from the boom. Hedge against the bust.
Best Wishes,
 |
Catherine Cashmore,
Editor, Land Cycle Investor

Comments