

• Skip to primary navigation
  • Skip to main content
  • Skip to primary sidebar
  • Skip to footer
  • Home
  • Latest
  • Videos
  • Series
  • E-Newsletters
    • Fat Tail Daily
    • James Cooper’s Mining Memo
    • The Daily Reckoning Australia
  • Categories
    • Commodities
    • Macro
    • Market Analysis
    • Small Caps
    • Technology
  • Investment Guides
  • Premium Services
  • Editors
  • About
  • Contact Us
Fat Tail Daily
Subscribe
  • Home
  • Latest
  • Videos
  • E-Newsletters
  • Premium Services
Latest ASX News

Kogan Share Price Falls on Business Update (ASX:KGN)

Like 0

By Carl Wittkopp, Friday, 29 January 2021

At time of writing the Kogan.com Ltd [ASX:KGN] share price trades at $18.88 down 3.97%. Kogan.com showed incredible growth throughout 2020, is it starting to run out of steam? 2020 was an amazing year for many reasons...
At time of writing the Kogan.com Ltd [ASX:KGN] share price trades at $18.88 down 3.97%.

Kogan.com showed incredible growth throughout 2020, is it starting to run out of steam?

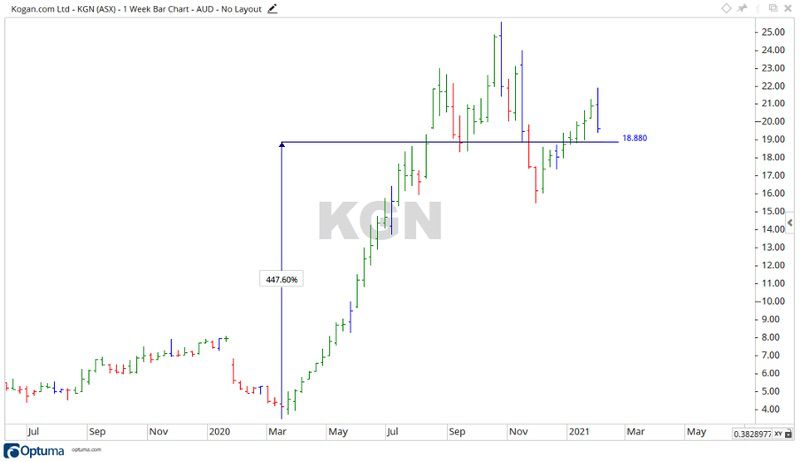
ASX KGN Share Price Chart 1

Source: Optuma

The rise of Kogan

2020 was an amazing year for many reasons. The global pandemic changed everything.

Causing lockdowns and stay at home orders across the globe.

The knock-on effect became a lot of people at home shopping.

For Kogan, the expansion of online shoppers saw their share price shoot up along with their revenue.

The company recently announced an update and reported outstanding growth.

1HFY21 highlights across the Kogan Group include:

  • Gross sales grew by more than 96%
  • Gross profit grew by more than 120%
  • Adjusted EBITDA2 grew by more than 175%
  • EBITDA grew by more than 140%
  • Cash at period end was AU$78.9M with AU$1.4M of the Group’s debt facility three drawn within Mighty Ape
  • Active customers was 3,003,000 for Kogan.com and 719,000 for Mighty Ape
  • The business had its first $30M+ week

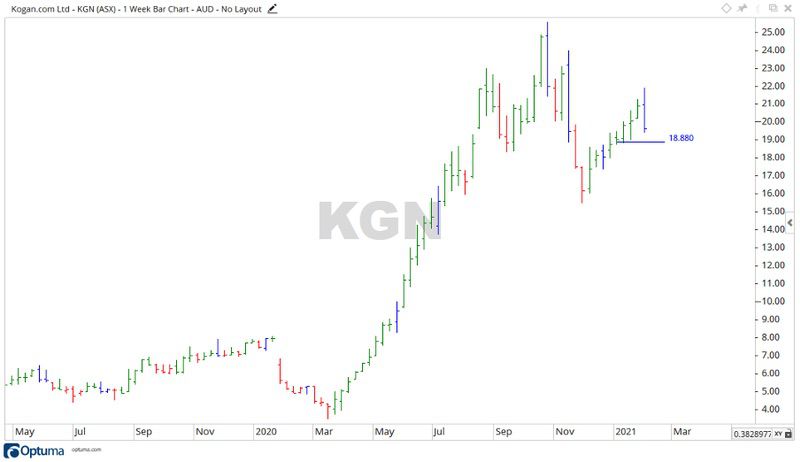
ASX Kogan Share Price Chart 2

Source: Optuma

Throughout the odd year that was 2020, KGN have been able to capitalise on the chaos.

With the Kogan share price rising more than 447% to where it trades at time of writing.

Is it time for Kogan to fall?

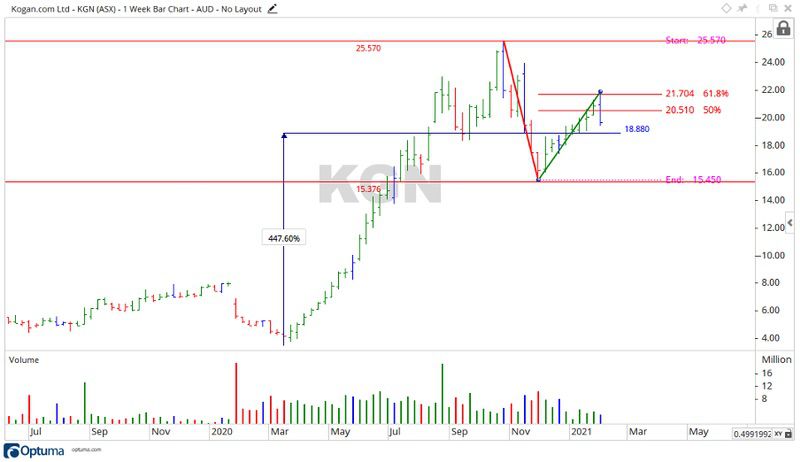
In October 2020, KGN reached an all-time high price of $25.57 before falling away into the low at the end of November 2020.

From the low the share price moved up to $21.70 or 61.8% of the prior range with the move up taking place on declining volume.
ASX KGN Share Price Chart 3

Source: Optuma

Both the move down (red line) and the move up (green line) may be countertrend moves.

For Kogan to be considered bullish still, the price would have to break the all-time high of $25.57.

Should the price fall below $15.54 and create a newer low, then Kogan could be considered to be bearish.

Nothing goes up forever and while KGN had a fantastic 2020, at some point the share price needs to come down, which we may be seeing the start of now.

For those that made a good profit trading Kogan this past year, it may be time to sit tight and wait for the next rally.

Those still holding positions — monitor the next couple of weeks closely and look for the indications of the share price being bullish or bearish and react accordingly.

Our publication Money Morning is a fantastic place to start on your investment journey. We talk about the big trends driving the most innovative stocks on the ASX. Learn all about it here.

Regards,

Carl Wittkopp

For Money Morning

All advice is general advice and has not taken into account your personal circumstances.

Please seek independent financial advice regarding your own situation, or if in doubt about the suitability of an investment.

Comments

Subscribe
Notify of
guest
guest
0 Comments
Carl Wittkopp

Carl’s Premium Subscriptions

Publication logo
Fat Tail Investment Research

Latest Articles

  • The Reverse Centaur
    By Charlie Ormond

    The big AI labs have moved the race from chatbots to personal AI agents. But as tech critics warn, the same technology can make each of us the legs for a different kind of beast.

  • De-dollarisation is happening, so why has the monetary system not collapsed yet?
    By Brian Chu

    As the US national debt exceed US$40 trillion and the US-Israel-Iran conflict sent oil prices spiking, there is increasing speculation of a dollar collapse and the end of the petrodollar system. Today’s article shows you why now may not be the time…

  • The Crash Playbook for Small-Caps
    By Dr. Lachlann Tierney

    The RBA's rate rise stung, but the market shrugged it off. But a crash is inevitable (as it always is). Lachlann Tierney lays out what he’s looking for to weather the storm.

Primary Sidebar

Latest Articles

  • The Reverse Centaur
  • De-dollarisation is happening, so why has the monetary system not collapsed yet?
  • The Crash Playbook for Small-Caps
  • Prepare for Escalation: After US Midterms, All Bets Are Off
  • The recession they made us have

Footer

Fat Tail Daily Logo
YouTube
Facebook
x (formally twitter)
LinkedIn

About

Investment ideas from the edge of the bell curve.

Go beyond conventional investing strategies with unique ideas and actionable opportunities. Our expert editors deliver conviction-led insights to guide your financial journey.

Quick Links

Subscribe

About

FAQ

Terms and Conditions

Financial Services Guide

Privacy Policy

Get in Touch

Contact Us

Email: support@fattail.com.au

Phone: 1300 667 481

All advice is general in nature and has not taken into account your personal circumstances. Please seek independent financial advice regarding your own situation, or if in doubt about the suitability of an investment.

The value of any investment and the income derived from it can go down as well as up. Never invest more than you can afford to lose and keep in mind the ultimate risk is that you can lose whatever you’ve invested. While useful for detecting patterns, the past is not a guide to future performance. Some figures contained in our reports are forecasts and may not be a reliable indicator of future results. Any actual or potential gains in these reports may not include taxes, brokerage commissions, or associated fees.

Fat Tail Logo

Fat Tail Daily is brought to you by the team at Fat Tail Investment Research

Copyright © 2026 Fat Tail Daily | ACN: 117 765 009 / ABN: 33 117 765 009 / ASFL: 323 988