Interest rate suppression backed yield-starved investors into a corner.
They were forced to seek out (or remain invested in) higher yielding investments.
The recent volatility on Wall Street, combined with the RBA’s belligerent approach to maintaining NEGATIVE real (after inflation) rates, means investors are now facing a serious conundrum.
More and more people have been asking me, ‘What should I do?’
Well, the options are rather limited:
- Go…cash up and be content with the ‘return OF your capital’.
- Stay…remain invested and receive a ‘return ON your capital’.
- Or…a combination of 1 and 2. Reduce exposure to markets and increase exposure to cash.
When presented with these options, the ‘cake and eat it too’ responses generally follow.
‘If I cash up, then I’ll earn next to nothing on my money.’
‘If I stay invested, the market could fall further.’
In my experience, investors invariably want the best of both worlds…the security of cash AND the yield of shares.
The late Bernie Madoff had a product offering the same characteristics…it didn’t work out so well for Bernie or his investors.
Wall Street’s recent recovery has somewhat slowed investor pulse rates.
Is this ‘recovery’ a sign of things getting back to normal OR an uneasy calm before the mother of all storms is unleashed?
Personally, I struggle with the ‘things getting back to normal’ option.
The old normal — that created the greatest asset bubble in history — did not have food shortages, rising energy prices, higher inflation, upward pressure on global interest rates, newly drawn geopolitical fault lines, and murmurings of nuclear war to contend with.
Underneath the surface, something big is building. There are stresses and tensions in this highly leveraged system that are yet to be publicly revealed. When they are, anxiety and volatility levels will mirror each other.
To make an informed decision on whether to stay or go, investors who’ve chased dividend yield need to look at the entire investment story…not just the one dimension of higher income.
You need to consider ‘What’s the capital price to be paid for that additional income?’
The 4% line in the sand
In the years following the GFC, the All Ords struggled to match the S&P 500’s performance.
Why?
I think it was because of the interest rate differential.
In the US, rates went to zero and stayed there.
Whereas, here in OZ, we were still receiving more than 5% on cash and term deposits.
In weighing up the risk versus reward equation, popular thinking went something like this: security of capital plus 5% versus market risk plus 4–6% dividend.
That risk versus reward equation changed when the RBA decided to get serious about punishing savers and rewarding borrowers.
My gut feeling tells me a 4% interest rate was the line in the sand for investors in need of income. When that line was crossed, investors started looking around.
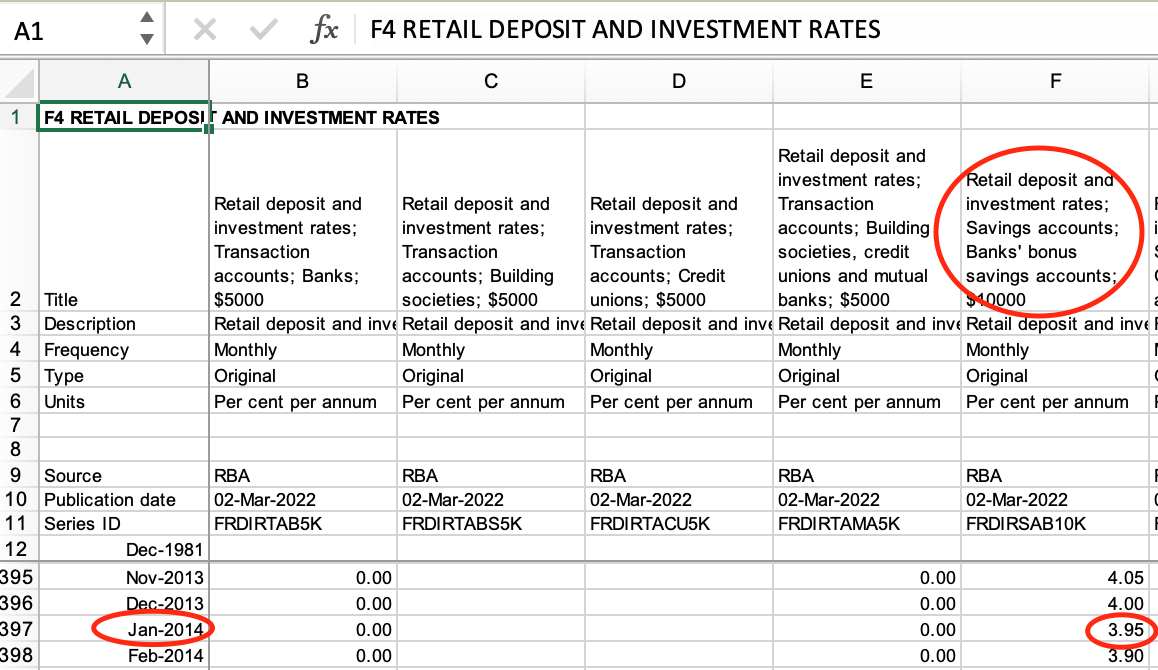
According to the RBA’s own spreadsheet, deposit rates dipped below 4% in January 2014:
|
|
|
Source: RBA |
The Australian Financial Review offered anecdotal evidence of the 4% line on 19 February 2014:
‘…investors in Australia turned to shares of the big four banks as cash rates were cut…’
As they say, ‘Why be a deposit holder when you can own the bank?’
Higher yielding bank stocks were (and still are) the popular choice for those yield-seeking investors.
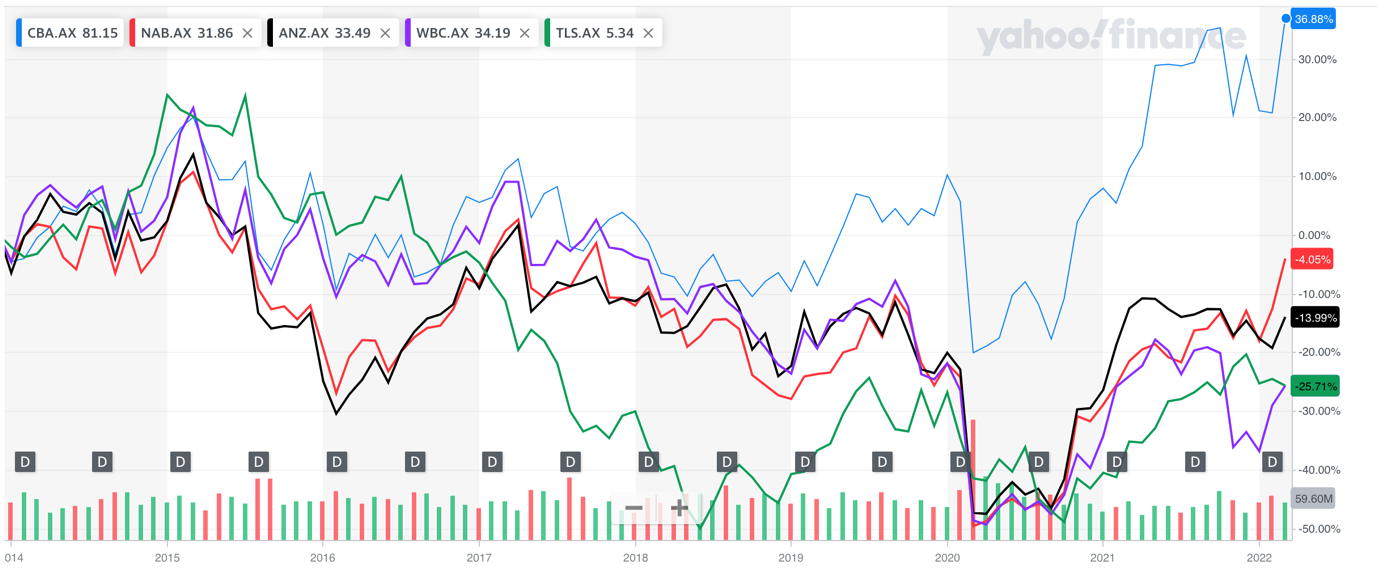
Let’s assume our prudent (former term deposit) investor (with $500k) decides in January 2014 to invest in the bluest of blue-chip, dividend-paying companies…the Big Four PLUS Telstra (which, at that time, was paying a very high dividend).
This might surprise you, but since January 2014, four of the five blue-chip stocks have been in negative territory. The exception is…Commonwealth Bank.
On an equally weighted basis ($100k in each stock), over the past eight years, the blue-chip portfolio has been down…MINUS 6.5%:
|
|
|
Source: Yahoo! Finance |
The original $500k portfolio is, at present, valued at $467.5k.
Ah, but what about the income?
On a simple maths basis, let’s say the portfolio’s grossed-up yield average is around 6%.
Over an eight-year period, this contributes around 50% to overall portfolio performance.
With the combination of capital and income, the total is…$717.5k.
Assuming cash/term deposit rates averaged 2% over the same period, capital and income in the bank would be around $580k…about $135k less.
It appears to be an open and shut case for the higher yielding blue-chip shares.
But nothing in the investing world is ever so simple or straightforward.
Lessons from the 2020 COVID correction
Prior to the COVID crash in March 2020, our blue-chip portfolio was down, on average, about 15% in value.
Add back six years of dividends (at 6% per annum), and the NET positive from January 2014 is around 20%.
Not all that much better from money in the bank…six years at 2% per annum. An extra few percent but with a lot more risk to capital.
And we got a glimpse of that capital risk in March 2020.
At its lowest point, the portfolio was MINUS 39%; the original $500k was down to $305k. OUCH!
Add back six years of dividends and you’re just about back to the $100k breakeven.
By comparison, in March 2020, money in the bank would have been around $560k.
Yes, I know, the market has recovered, and a snapshot of March 2020 is now purely academic…maybe, maybe not.
What happens if next time the Fed cannot manufacture a rapid recovery?
Capital value stays down AND…
Dividends, like interest rates, are variable
Dividends are NOT cast in stone.
Like interest rates, they too can rise, fall, and stagnate.
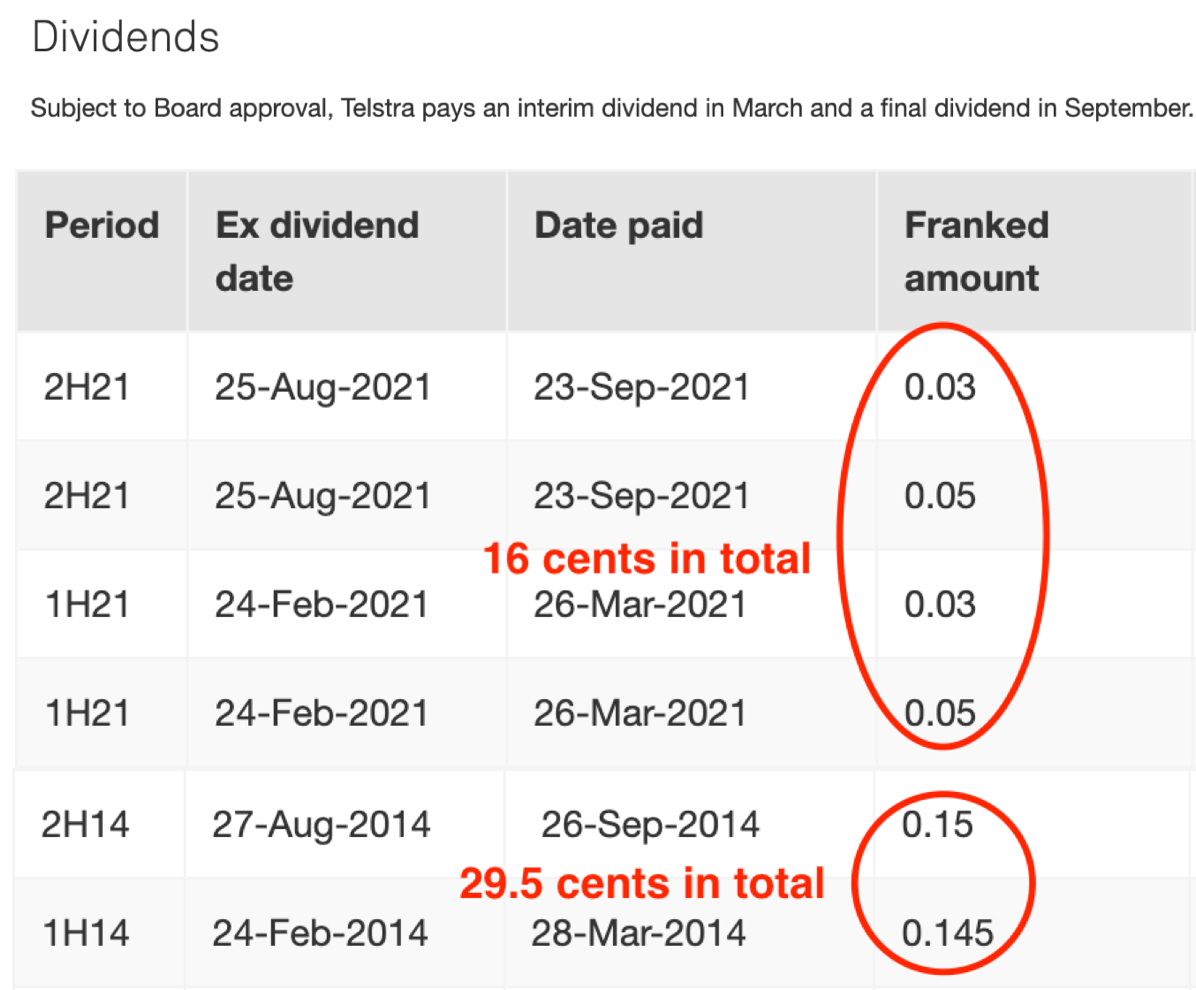
In 2014, Telstra was paying a dividend of 29.5 cents per share. Today, Telstra’s annual dividend is 16 cents.
Not only has our 2014 investor had an almost halving in dividend, but the Telstra share price is also down 25%:
|
|
|
Source: Telstra |
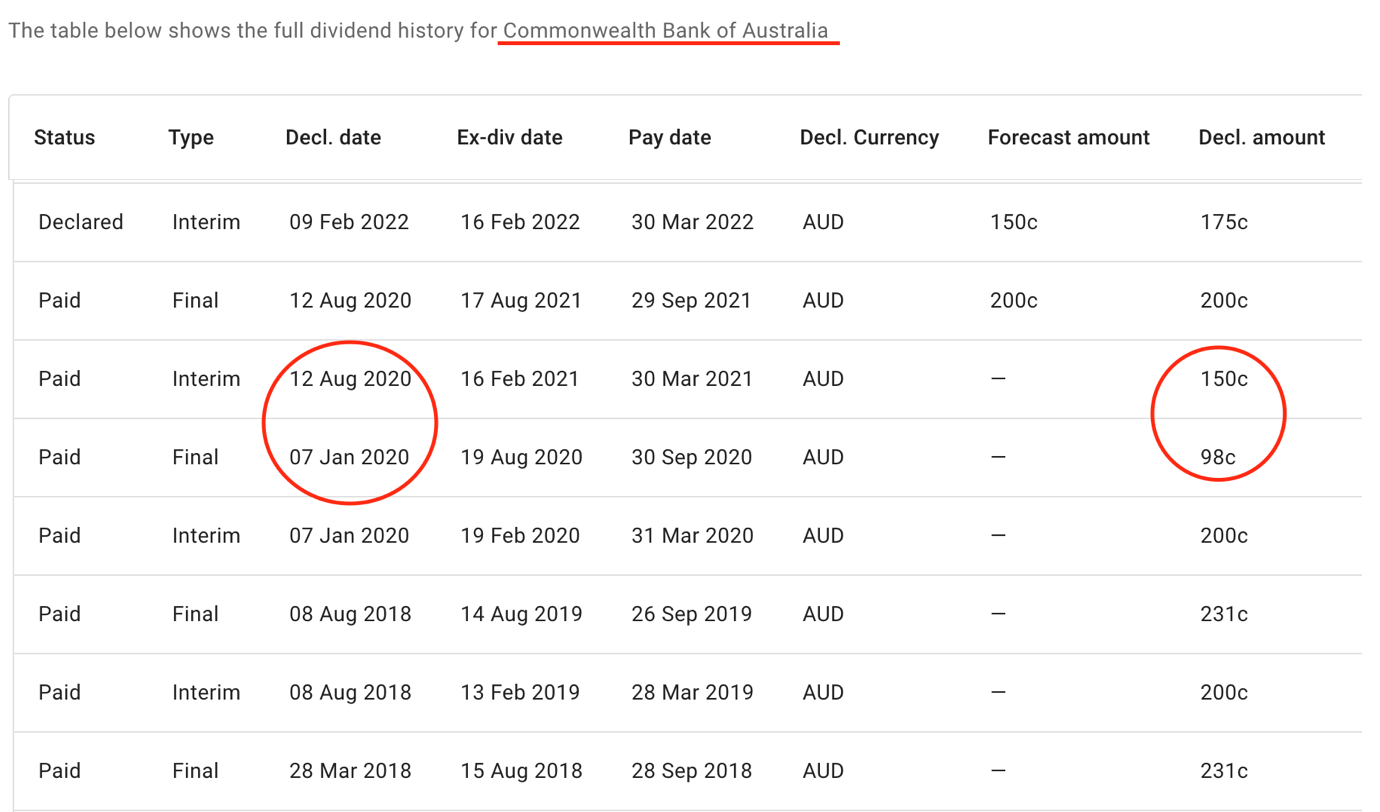
During the COVID crisis, the banks also reduced dividends.
As an example, the CBA, prior to March 2020, paid an annual dividend of $4.31 per share.
In 2020/21, the dividend shrank to $2.48 per share and is now back to $3.75 per share:
|
|
|
Source: Dividend Max |
PLEASE NOTE: The share falls (four of the five stocks) and dividend reductions have occurred in the GOOD times…what’s going to happen when the greatest asset bubble in history final does blow its top?
Learn from history or your capital will be history
Investors who bought into the ‘higher yield’ narrative might like to take heed of what happened to US blue-chip shares in the Great Depression.
In February 2017, I wrote an article about the impact the Great Depression had on ‘blue-chip’ companies to pay dividends.
Here’s an extract:
‘In 1929, the [S&P 500] index produced average earnings of US$22.60…three years later, earnings had fallen to one-third of this figure.
‘It took nearly 20 years for earnings to reach the US$22 level again.
‘When a share market suffers a fall of 80%, you can be assured there will be economic consequences. People have less money to spend. Less money going through the cash registers means less corporate profits.
‘If businesses are earning less, guess what happens to dividends?
‘They are reduced or even, cancelled.
‘In Barrie A Wigmore’s rather lengthy book The Crash and Its Aftermath: A History of Securities Markets in the United States, 1929-1933, there’s a treasure trove of data on what happened to shares during the Great Depression.
‘Here’s a selection of blue-chip companies and the level of share price fall suffered from 1929 to 1933 and dividend being paid in 1933.’
|
|
Three of the seven ‘blue-chip’ companies ceased paying dividends. The other four appeared to be paying a high level of dividends…but, as mentioned earlier, in the investing world, nothing is ever simple and straightforward.
Take Gillette…paying a 13.77% dividend.
On the surface, this looks good.
However, that dividend percentage was calculated on a share price 95% lower than it was four years earlier.
Here’s the maths:
‘To keep this exercise simple, we’ll work in whole numbers:’
|
|
In dollar terms, the dividend shrank more than 80%…from $4 per share in 1929 to 70 cents per share in 1933, AND the share price fell 95% in value.
The only difference between Gillette circa 1930s and Telstra is that the percentages are bigger.
But it’s the same principle.
The lesson from 1929 (and the COVID correction) is that when the share market goes through a significant correction and the economy struggles to respond to stimulus efforts, dividends will be cut…and cut hard.
If you think it’s difficult now to live off a 0.5% return on 100% of your capital, what will it be like living off a reduced dividend payment on less than half your current capital value?
Knowledge pays the best dividends.
Regards,
 |
Vern Gowdie,
Editor, The Daily Reckoning Australia
