
I hope you had a great Easter break. I will spend today outlining how I decide prices have potentially changed direction. It is an important thing to define in trading. Price action is so complex that the very idea of ‘up’ and ‘down’ is difficult to define.
For example, with the price of some stock bid at say $10.00 and offered at $10.01, would you define each time it trades as either price ‘going up’ or ‘going down’? If that is too granular for you, what should the definition be?
Many would point to moving averages as a useful tool to define such things, but in my experience moving averages aren’t as good as they look at first sight. There are far too many false signals at shorter time frames and prices move so fast that you end up acting far too late if your moving average is set at a point where it filters out a lot of false signals.
Lagging indicators are just that, lagging. If prices are trending strongly for long periods of time it can appear as if moving averages are the easy path to riches. But once prices enter a consolidation phase, you soon find out that moving averages can cause a lot of losses very quickly.
If you have a huge amount of money, there is a case that you can put up with plenty of losses during consolidation periods because you make so much during the trends. But let’s face it, most of us aren’t made of money and the prospect of taking loss after loss for months will quickly wear thin. It’s not the way I want to trade.
So we need a definition that isn’t lagging, but is repeatable and defines a change in market direction quickly.
The definition I have settled on to work out when a market is potentially changing direction is the buy and sell pivot. I will define it for you below.
The reason I use the buy and sell pivot to help me with entry signals is because markets quite literally can’t change direction in whatever time frame I am using without one being present.
For example, if prices are going down day after day with lower highs and lower lows, how could prices turn back up without closing above the high of the day with the lowest price in the whole move?
Simplified example of buy and sell pivots
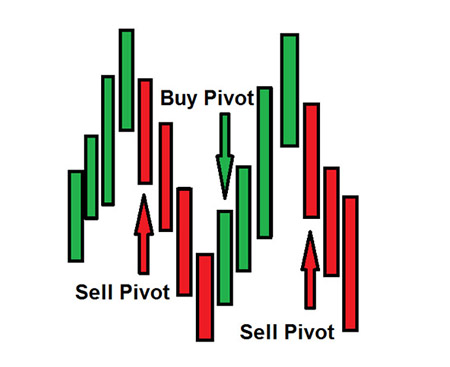
Source: Port Phillip Publishing
[Click to open new window]
Quite clearly the very first thing that must happen if prices are going to change direction is that a buy or sell pivot must be seen.
Unfortunately, that knowledge alone is worth nothing. But it can certainly come in handy when looking at price action from very large time frames.
Let’s have a quick look at a quarterly chart of the ASX 200 over the last 20 years using this definition of buy and sell pivots. A quarterly chart means that each candle shows three months of trading.
Buy and sell pivots come in handy
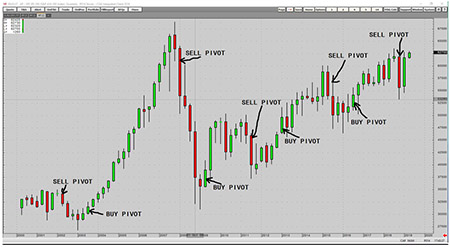
Source: CQG Integrated Client
[Click to open new window]
There have only been four sets of buy and sell pivots over the last 20 years, and we have just seen a sell pivot on the quarterly chart in the December quarter last year. Have a look at the chart and imagine that you had a definition of market direction as whatever the most recent buy or sell pivot was.
I.e. if the most recent pivot was a buy pivot your bias for direction was ‘up’.
That simple definition came in handy over the last 20 years.
The shorter the time frame you use, the higher the number of false signals that are generated. That is, until you get to a five-minute chart and can find buy and sell pivots literally everywhere.
The buy and sell pivots alone are worth little, but they are an important part of the whole jigsaw. It is combining them with the knowledge of where markets often change direction within a wave or range that heightens their strike rate. There is also an added level of analysis that follows once these buy or sell pivots occur that creates my edge, but I will keep that information for my subscribers.
We are now slowly making our way towards a simplified model of price action that will help us to enter trades when the risk/reward is in our favour.
Remember I am trying to find the points where I am proven wrong. I want to be proven wrong quickly once I enter a position so I can leverage up the size of my trades based on the dollars at risk per trade.
I would prefer to buy a stock in long-term uptrend when it is weak in the short term. I want to enter trades that will mean revert to the point of control of either a wave or a range so I can take part profit quickly and become free carried on the trade.
By doing that I will be planting a lot of seeds in the market where the outcome will be that I either break even or make some money. I call such an outcome a ‘free option’, because I am getting a free look at what comes next without risking my initial capital. (Overnight gap risk can cause losses, but they are rare and manageable.)
Once I’m free carried, I don’t care what happens. I don’t know the future anyway, so I’d prefer to be watching what happens without feeling caught up emotionally in every twist and turn.
In the next few articles I will describe different scenarios where markets often change direction and then we will combine all the things I have shown you into a trading model.
Once that is done, I can start looking at what is happening in the markets real time. That’s when the rubber hits the road.
Regards,
Murray Dawes,
Editor, Alpha Wave Trader
PS: Discover the hidden treasures available to everyday investors from this often overlooked sector of the market…Penny Stocks. Download your free report now.

Comments