
‘When your neighbour loses his job, it’s a slowdown; when you lose your job, it’s a recession; when an economist loses his job, it’s a depression.’
Anon
Is a recession coming?
You can’t read the paper or channel surf these days without hearing mention of a looming recession.
Economists, strategists, hedge fund managers, and callers of past recessions all line up to deposit their two cents and the media happily pockets it.
Just yesterday, not one, but three banks came out with their predictions.
Investment bank Nomura forecast the US to enter a mild recession in the fourth quarter of this year, with our own National Australia Bank forecasting the US to enter a recession in 2023.
The Commonwealth Bank went further, predicting that monetary tightening will cause a global economic slowdown, triggering recessions in the US, the UK, the Eurozone, and Japan.
CBA’s head of international economics, Joseph Capurso, didn’t mince words:
‘The FOMC [Federal Open Market Committee] does not have a good record of engineering a “soft economic landing”. With the policy interest rate set to be restrictive, we forecast the US economy will enter recession in 2023.’
We’re awash with recession-talk.
But how can anyone tell if a recession is near? What do you look for?
Let’s cover a few possible recession indicators below.
Dr Copper’s diagnosis
A recession is a period of economic downturn where aggregate output declines for at least two
consecutive quarters.
The National Bureau of Economic Research (NBER) defines a recession as:
‘A significant decline in economic activity spread across the economy, lasting more than a few months, normally visible in real GDP, real income, employment, industrial production, and wholesale-retail sales.’
From that definition alone we can collate important factors to monitor when pondering a recession: changes in real GDP, real income, employment, industrial production, and retail sales.
But we can take a shortcut by appraising economic activity, of which the listed factors are constituents.
One such shortcut is copper, or Dr Copper.
It’s joked that copper is the one metal with a PhD in economics because of its broad integration with the wider economy.
Generally, if copper’s price is high and rising, then the industrial economy is likely doing well. If copper’s price is low and falling, then the industrial economy is likely stalling.
As Frank Holmes, chief investment officer of US Global Investors explained, ‘copper has unique physical properties that make it the backbone of the industrial economy’.
Copper can also help predict recessions, according to Holmes’s colleague Brian Hicks. In Hicks’ view, if copper prices are plateauing, it’s a sign the economy is sluggish.
What’s the current copper market signalling?
Yesterday, the Australian Financial Review reported that the front-month copper futures contracts closed at the lowest levels since last spring.
According to Fundstrat Global’s Mark Newton, ‘that’s a huge decline in a short-period of time’.
Consumer spending
Clearly, if a recession is characterised by a slowdown in economic activity, a big tell is consumer spending.
If all of us start spending less on takeout, movie nights, or discretionary goods and if we start pulling our gym and Netflix memberships, things won’t be looking great for the economy.
For instance, in April, UK bank Lloyds reported that its customers cancelled about 1.2 million gym memberships and video streaming contracts over the past six months.
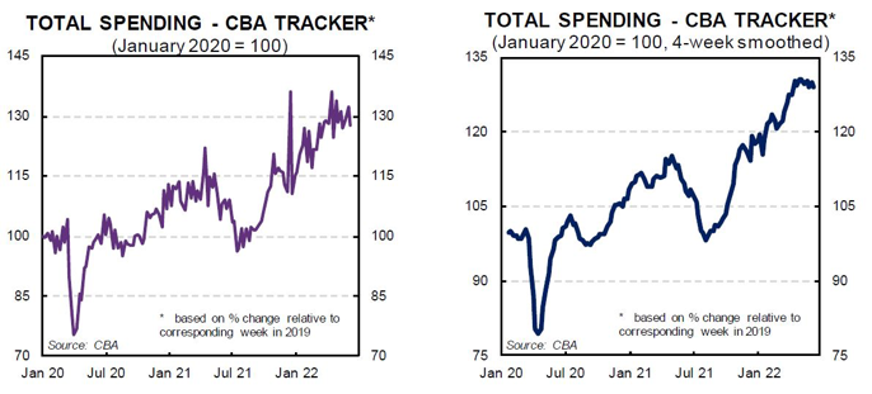
This week, CommBank reported its internal credit and debit spending data for the fortnight ending 17 June.
CBA found that spending growth fell marginally in Australia.
Household spending ‘remains elevated, but a moderate softening is underway’:
|
|
| Source: CBA |
While consumer spending is moderately softening, consumer sentiment is cratering.
The Westpac-Melbourne Institute Index of Consumer Sentiment fell 4.5% in June, reaching its ‘lowest level since the peak of the pandemic’.
And if you exclude the pandemic, the reading is the worst since February 2009.
Car sales
When are you most likely to buy a car?
Probably when your finances are solid, your job prospects sound, living costs manageable, and your debt serviceable.
In recessionary times, that’s not guaranteed.
So dwindling new car sales can act as a leading indicator of recession.
Automobile sales are large purchases, eating into a big chunk of our savings. Unsurprisingly, many of us take out loans to service the purchase.
Car sales serve as stand-ins for consumer confidence. If car sales are falling, it may suggest people are less confident about keeping their jobs or being able to maintain their loan payments.
As Duke professor of finance Campbell Harvey noted :
‘This is not a niche indicator. The auto industry is interconnected with so much else that by watching its movements you get some view of the overall health of the economy.’
How are car sales going in the bellwether US market?
Not great.
On June 2, Bloomberg reported :
‘Sales of new cars last month fell to 12.8 million vehicles at a seasonally adjusted annualised rate, representing an 11% drop from April, according to data compiled by Wards Intelligence.
‘That is the lowest level since December and reflects shrunken inventories amid a persistent shortage of semiconductors and near record-high vehicle prices.’
Yield inversion
Yield inversion. It sounds like a Top Gun fighter pilot manoeuvre. What is it?
Yield inversion is also known as the flattening yield curve and refers to the phenomenon where short-term interest rates exceed long-term rates.
What does an inverted yield signify? A decelerating economy.
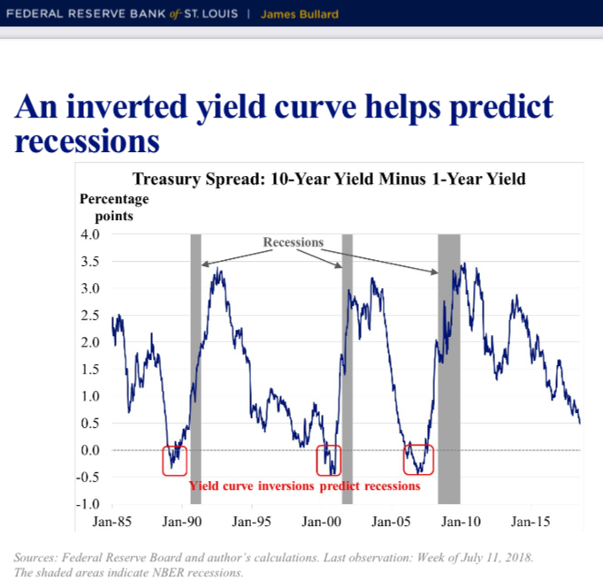
Here’s a nice explanation from the US Federal Reserve:
‘A high 1-year yield signals high expected growth over a 1-year horizon. A high 10-year yield signals high expected growth over a 10-year horizon. If the difference between the 10-year yield and 1-year yield is positive, then growth is expected to accelerate. If the difference is negative—that is, if the real yield curve inverts—then growth is expected to decelerate. ’
In a 2018 presentation, St Louis Fed President Jim Bullard noted that an inversion is a ‘naturally bearish signal for the economy’.
An inverted yield is a bearish signal because it has a solid history of preceding recessions.
As Bullard went on:
‘Nevertheless, the empirical evidence is relatively strong…The empirical proposition that an inverted yield curve helps predict recessions makes sense to the extent that lower longer-term nominal interest rates may be a harbinger of both lower growth prospects and lower inflation in the future.’
|
|
| Source: St Louis Fed |
Last Tuesday, the US Treasury yield curve inverted briefly, flashing a recession signal. The previous inverted occured in April.
However, head of Robeco Asset Management Colin Graham told The Wall Street Journal:
‘You have to see a sustained period when the yield curve inverts in order to give a proper signal. One day here and there doesn’t really work.’
|
|
| Source: St Louis Fed |
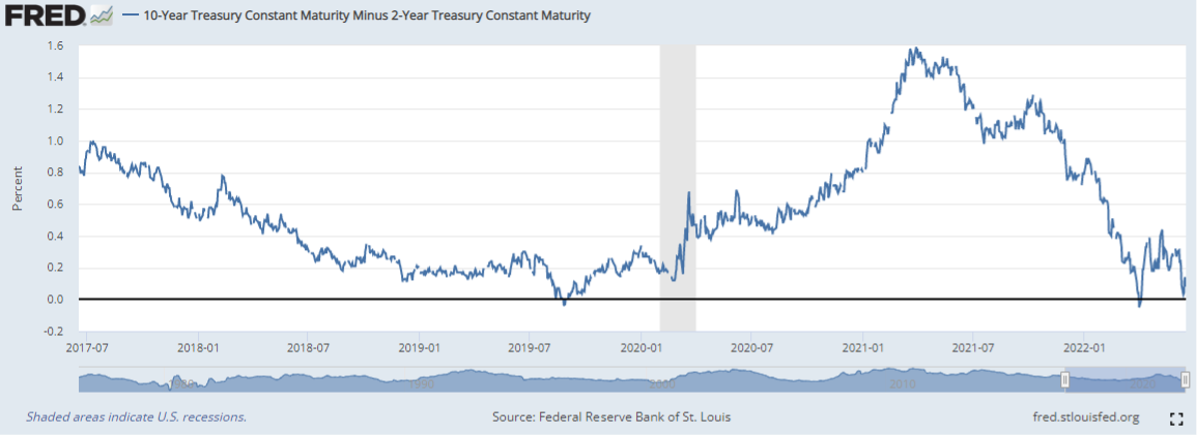
Currently, the spread between the 10-year US Treasury yield and the 2-year US Treasury yield is a paltry 0.08.
Inflation expectations: short and long term
Relatedly, we can also complement analysis of the yield curve by monitoring inflation expectations.
A common way that’s done is via the five- or 10-year breakeven rates.
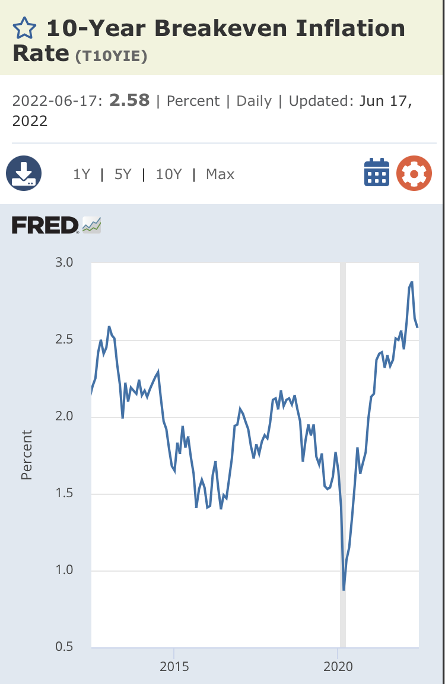
As the Federal Reserve explains:
‘The breakeven inflation rate represents a measure of expected inflation derived from 10-Year Treasury Constant Maturity Securities (BC_10YEAR) and 10-Year Treasury Inflation-Indexed Constant Maturity Securities (TC_10YEAR).
‘The latest value implies what market participants expect inflation to be in the next 10 years, on average.’
The current 10-year breakeven rate is 2.58% and the five-year breakeven inflation rate is 2.8%, respectively.
|
|
| Source: Federal Reserve St Louis |
Yet new projections show that all 18 Fed officials expect the central bank to raise rates to at least 3% this year.
And at least half of the Fed officials indicated that the fed funds rate might need to rise as high as 3.375% by the end of this year.
If that’s the case and the US sees at least 3% interest rates by the end of the year, we’ll have short-term interest rates well above the market’s outlook for long-term inflation.
And as St Louis Fed president Jim Bullard said, that’s a bearish signal for the economy.
All up, central banks find themselves in a tough spot.
Jim Rickards summarised it best in his interview with Fat Tail’s own Nick Hubble:
‘Inflation will only come down when rates get high enough but rates can’t get high enough without causing a recession.’
How will central banks resolve the conundrum?
Inflation or recession, that’s the question. Central banks’ actions the rest of the year will go a long way in revealing their preferred answer.
Regards,
Kiryll Prakapenka,
For Money Morning
