
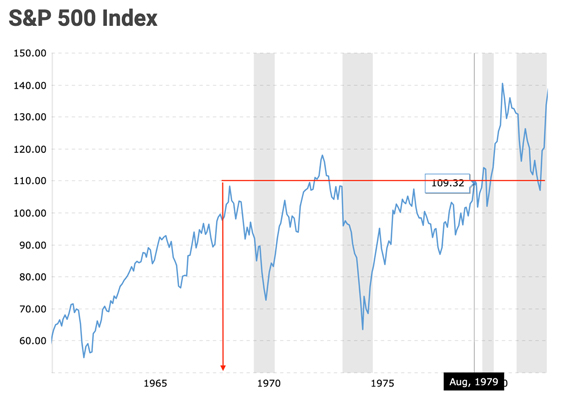
BusinessWeek’s cover story in August 1979, was…‘The Death of Equities…How Inflation is destroying the stock market’.
|
|
| Source: Business Week |

With hindsight, we can have a little chuckle at the premature reading of the market’s last rites. However, the cover story is a simple, but highly effective example of social mood.
Most people don’t realise that by August 1979, the US market (S&P 500) had gone nowhere for more than a decade.
Investors had been ground down and could see no end in sight to this misery.
And, as the chart shows, after August 1979, investor despair continued for another three years…finally bottoming out in 1982…
|
|
| Source: Macro Trends |
What a difference 44 years can make in the financial headline business.
This is from the 18 June 2023 edition of The Wall Street Journal…
|
|
| Source: WSJ |
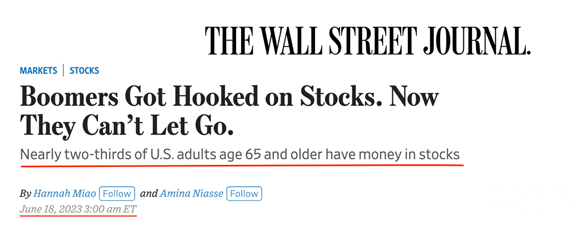
To quote from the article (emphasis added):
‘Nearly two-thirds of US adults aged 65 and over own equity through individual stocks, mutual funds or retirement savings accounts, according to an April survey by Gallup. This is up from roughly half of Americans in the same cohort before the 2008 financial crisis.
‘Conventional financial wisdom suggests investors should rotate from risk assets such as stocks into havens such as bonds as they get older. But individuals who have experienced high stock-market returns over the course of their life report higher financial-risk tolerance and are more likely to invest in the stock market and allocate a greater share of their portfolio to equities, according to research by finance professors Ulrike Malmender and Stefan Nagel.’
In 2023, we have a social mood that’s the polar opposite of 1979…‘Individuals who have experienced high stock-market returns over the course of their life report higher financial-risk tolerance’.
While the 1979 and 2023 investor outlooks are vastly different, the thought process behind the two contrasting positions is identical…‘Whatever our lived experience has been, it will continue to be so’.
And this is what boomers have experienced over the course of their life…
|
|
| Source: Macro Trends |
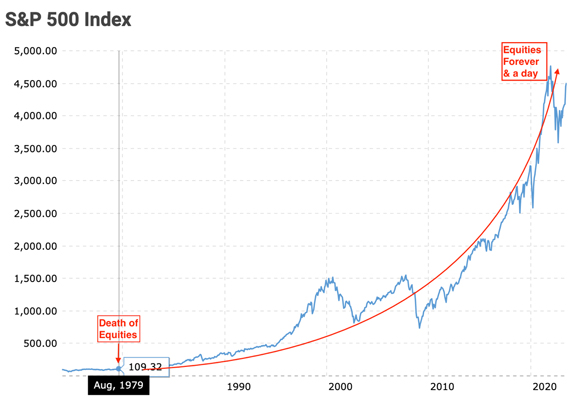
Why has the S&P 500 gone up 48-fold?
The US share market (which radiates to the rest of the world) has been very, very kind to investors…a 48-fold increase in value (as at the S&P peak in January 2022) over a 40-year period.
For a little context on just how extraordinary a 48-fold increase in value is in the history of share markets, it took the Dow Jones Index almost 90 years (from August 1896–October 1985) to achieve this feat.
What investors have experienced, and now consider as ‘normal’, is anything but normal.
It’s a massive aberration…and one that’s highly unlikely to be continued.
Why?
Because there have been three powerful drivers behind this exceptional period of market history that will not be repeated in our lifetimes.
And this information comes from none other than the institution responsible for blowing three of the biggest asset bubbles in history…the US Federal Reserve.
In June 2023, the Fed published this discussion paper…
|
|
| Source: US Federal Reserve |
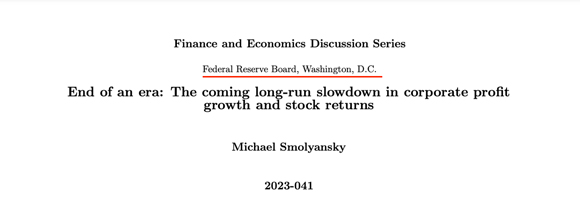
After studying 60 years (from 1962–2022) of earnings data and S&P 500 performance, the paper concluded (emphasis added):
‘…the 30-year period prior to the pandemic was exceptional.
‘During these years, both interest rates and corporate tax rates declined substantially. This had the mechanical effect of significantly boosting corporate profit growth.
‘Specifically…the reduction in interest and corporate tax rates was responsible for over 40% of the growth in real corporate profits from 1989 to 2019.
‘Moreover, the decline in risk-free rates over this period explains the entirety of the expansion in price-to-earnings (P/E) multiples.
‘Together, these two factors therefore account for the majority of this period’s exceptional stock market performance.’
The three unrepeatable drivers of stock returns
Earnings were boosted by:
Falling interest rates.
Falling Corporate Tax Rates.
Share prices were increased by:
P/E multiple expansion.
Let’s look at these individually.
Interest rates — well, any boomer who had a mortgage in the late 1980s knows that interest rates were in the ‘teens’. Over the next 30 years, loan rates fell into the low single-digit range. This was a boon for US corporate borrowers.
However, what’s the likelihood of this being repeated? Buckley’s and none.
Why? Because today we do not have rates in the ‘teens’, they are already low PLUS debt levels are higher. In the future, there will be no earnings ‘kicker’ from falling rates.
US tax rates — to quote from the Fed discussion paper (emphasis added):
‘The effective [US] corporate tax rate for S&P 500 nonfinancial firms declined from 34% in 1989 to 15% in 2019.
‘Could corporate tax rates fall further?
‘It’s possible.
‘However, the Tax Cuts and Jobs Act of 2017 cut the statutory corporate tax rate from 35% to 21%. With the ratio of US debt-to-GDP near all-time highs, another deficit-financed cut in corporate taxes does not appear likely anytime soon.’
The combined effect of these two earnings boosters is evident in this chart from the Discussion Paper…Interest and Tax Expenses as a share of Earnings Before Interest and Tax (EBIT), fell significantly over the Boomers investing lifetime…
|
|
| Source: US Federal Reserve |
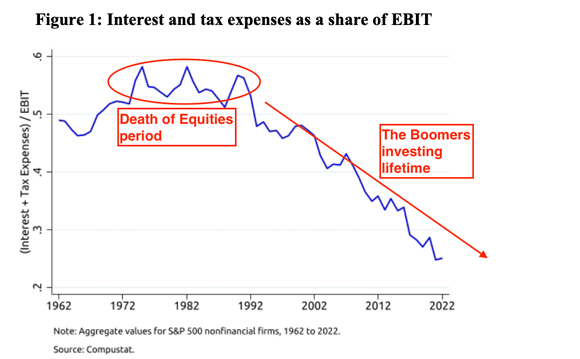
It’s fair to assume these two earnings boosters have pretty much run their course. There might be a little more left, but not to the same noticeable degree…especially if the US economy continues to turn out sluggish GDP growth.
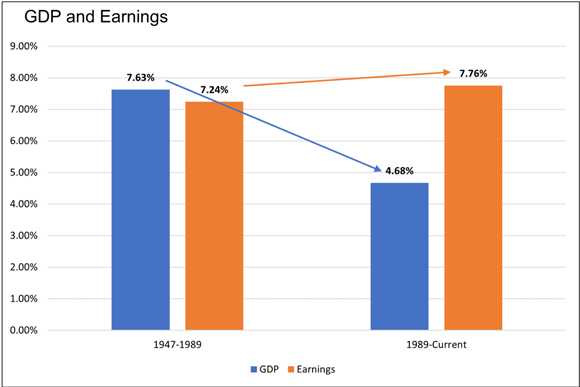
Prior to 1989, US corporate earnings growth mirrored the growth in the US economy. However, after 1989, and as unproductive debt loads became a greater drag on economic growth, earnings — thanks to the lower tax rates and interest rates — actually grew faster than the underlying economy.
Again, that’s not normal.
And, if there’s one constant principle in life, it’s that imbalances in one direction tend to get corrected by a swing in the other direction.
Could the future consist of sub-par earnings growth for US Corporates?
Quite possible.
|
|
| Source: RIA |
So, how about P/E expansion?
Anything left in the tank there?
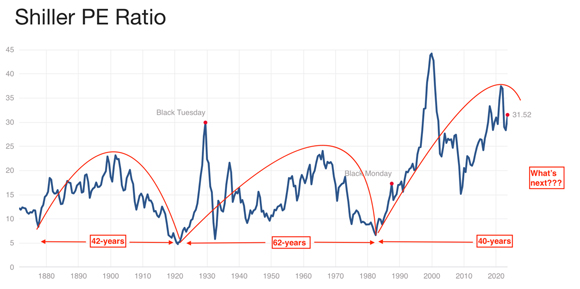
If we go through history, we can see there are distinct cycles — lasting decades — in the rotation of PE multiple expansion and contraction.
|
|
| Source: Multpl.com |
To illustrate the power behind PE expansion, here’s the difference in the value of $1 in earnings between 1983–2023…
| Year | P/E Multiple | Earnings | Value |
| 1983 | 6 times | $1 | $6 |
| 2023 | 31 times | $1 | $31 |
Same $1 in earnings, but in the period immediately after The Death of Equities, it was valued at $6. But, with Boomers now (almost) all-in, it’s worth five times as much.
Go figure.
So, can the PE multiple expand another three, four or five times AND remain permanently at a level well above the freakish high on the dot-com bubble?
It’s not too much of a stretch to say, ‘no chance of that happening’.
From Crescendo to Collapse
Where does that leave us on prospective share market returns in the coming years/decades?
No significant interest rate kicker.
In an era where the government is looking for more tax revenue — funding welfare, healthcare, warfare, climate change — it’s more likely corporate tax rates will be increased, not decreased.
Finally, can P/E ratios expand in an environment when life (courtesy of higher rates and inflation — like in the 1970s) gets a little tougher and the social mood is not quite so upbeat?
If history has taught us anything about long-term cycles, it’s ‘what has been, is NOT what’s going to be.’
Maybe, in a decade or two, we might be looking at the 18 June 2023 Wall Street Journal headline and saying ‘What were they thinking?’
We are building towards a spectacular crescendo…what comes next is the beginning of a period when belief systems get turned into disbelief.
Regards,
 |
Vern Gowdie,
Editor, The Daily Reckoning Australia
