US markets were closed last night for the Labor Day holiday. After the large sell-off that we saw last week, everyone is on tenterhooks to see whether a larger correction is on the way.
I reckon it all hinges on US bonds.
Bonds initially rallied as US stocks sold off hard on Thursday, but then changed direction on Friday and bond yields spiked higher (bonds sold off).
There have been plenty of commentators pointing to the flat yield curve as the instigator of the mad rally that we have seen in many markets.
The vertical move that we have seen in stocks like Apple Inc and Tesla could be seen as a repricing of their future cash flows now that the yield curve is expected to remain flat as a pancake for as far as the eye can see.
The Net Present Value (NPV) of cash flows in 10 years will go up if 10-year yields remain near 0.5%.
Gold is rallying for the same reason, so we are in the strange situation where seemingly uncorrelated investments are morphing into the same trade.
I think the case for gold going forward is strong despite the fact we may see some short-term weakness if the long end of the US yield curve sells off. If you want to get fired up about the opportunity for making some serious dosh in gold over the next few years, you should read The New Case for Gold by Jim Rickards.
Free Report: ‘Why Your Bank Dividends Could Be Under Threat’
The Jackson Hole speech by Fed Chairman Jerome Powell shouldn’t be ignored even if it seems that the market has taken it in its stride. Signalling to the market that the Fed is going to allow inflation to run hot increases the risk significantly for holders of long-term bonds.
The yield on the 30-year bond is currently 1.47% (after rising 11bps on Friday). Do you think that’s a sound investment after the Fed made it clear recently that they aren’t going to use yield curve control to hold bond yields down?
Without the US Fed intervening in the long end of the yield curve and with promises that inflation will be allowed to run hot in future, the huge supply coming due to the COVID response should start to weigh on bond prices.
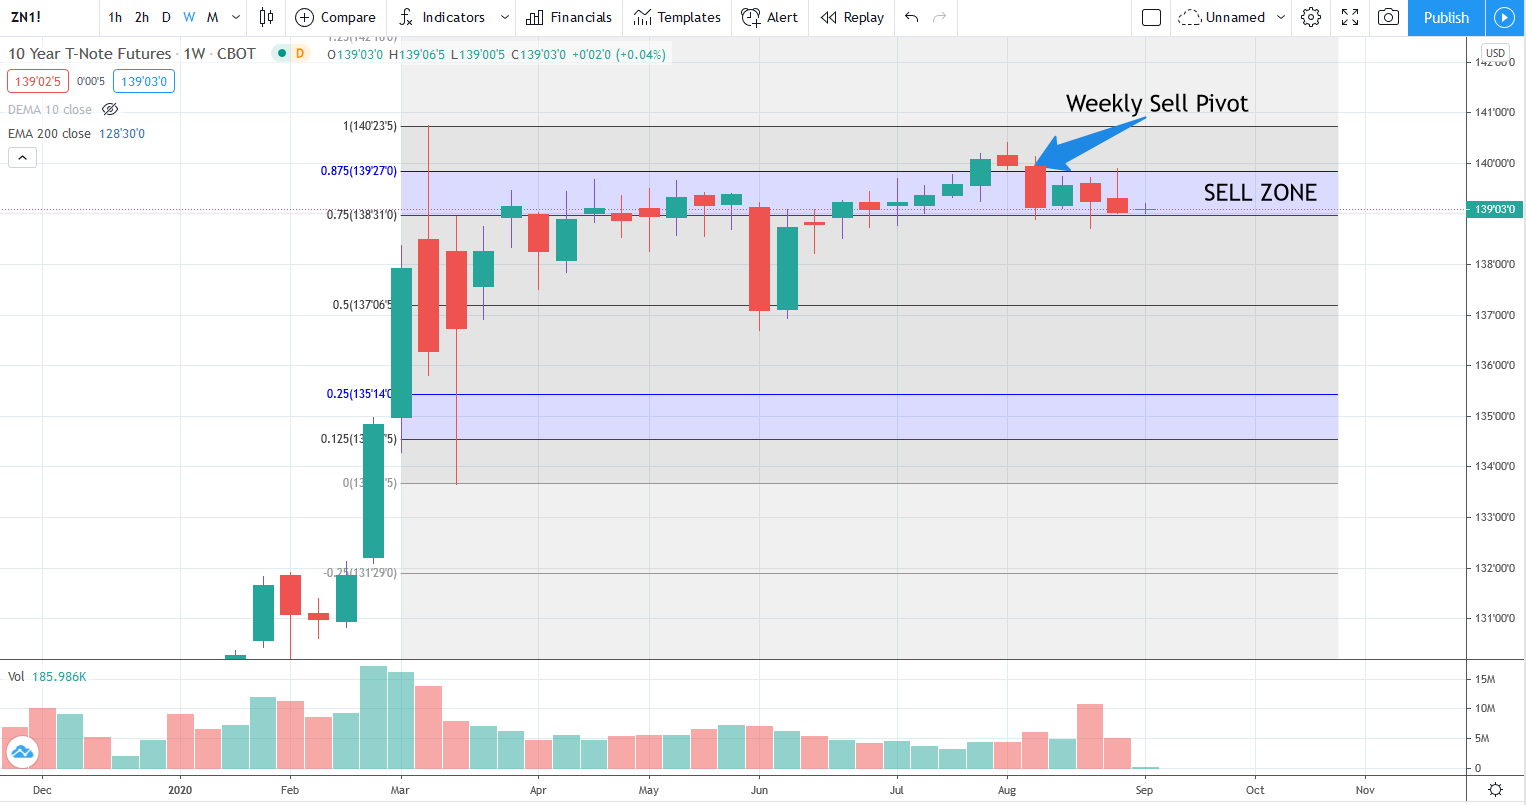
The current set-up from a technical point of view is picture perfect for a continued sell-off in bonds in the near future.
US 10-year bonds in weekly downtrend
|
|
| Source: Tradingview.com |
The range I have marked out above is based on the huge sell-off in bonds we saw during the crash. Prices recovered after the massive intervention by the Fed, but there has been plenty of resistance to the rally in the sell zone of the wave down in the crash.
The sell zone in my theory of price action is a 75–87.5% retracement of a previous wave. That’s the sweet spot where you can find trades with great risk/reward.
But first you need to see signs that prices are starting to change direction, and for that I use the buy and sell pivots.
A sell pivot occurs when prices close below the low of the candle that has created the highest price in the move. A large sell-off can’t occur until a sell pivot is confirmed, so it is a useful thing to keep your eye on.
It is the combination of finding the key zones where prices often change direction with the buy and sell pivots that creates the edge in my trading system though. Buy and sell pivots on their own are worthless.
The main point is that until we see a weekly buy pivot, the weekly trend for bond prices is down. The weekly sell pivot was confirmed four weeks ago and the price action since has increased my conviction that we should see prices continue to weaken.
If you see 10-year bond yields fall back below 0.5% from here (currently 0.72%), I am probably wrong, and stocks will likely recover the losses from last week. But until that happens there is a risk that bonds and stocks could sell-off in unison.
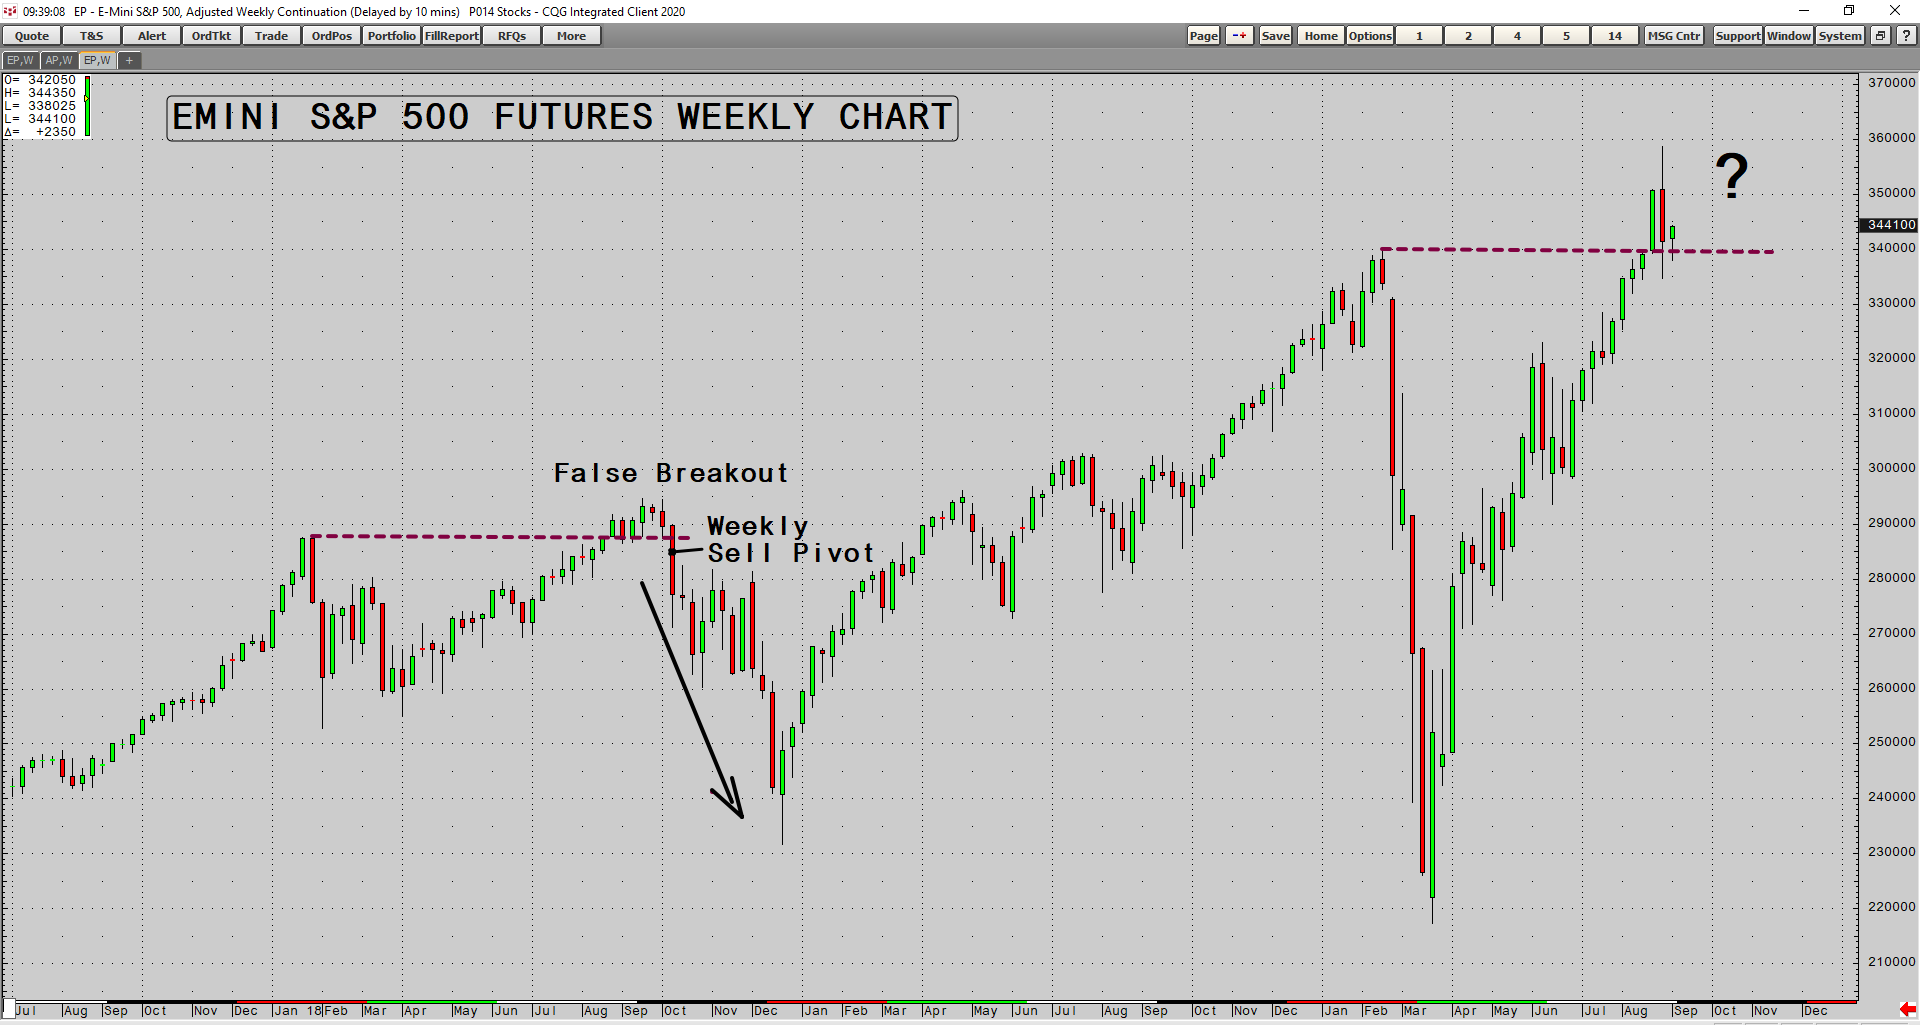
The other interesting thing to watch is how the S&P 500 trades around the all-time high set in February before the COVID crash.
If there’s one thing I’ve learnt in decades of observing markets, it’s that prices have far more false breaks than breakouts. Amateur traders are fixated on buying breakouts and they are usually wrong.
Whether you are a bull or a bear the constant process of false breaks is what trips up most traders. My preference is to fade the false break after it is confirmed.
It is still early days and I won’t want to act until a weekly sell pivot is confirmed in the S&P 500. But the price action last week has increased the odds that a false break of the high set in February may be on the cards in the next few months.
There’s no need to panic out of positions yet. The weekly trend remains up in the S&P 500 and until that changes higher prices may still be coming.
But if you are increasing your leverage in equities at the moment, you should be aware of the risks and ready to act if necessary.
Will history repeat?
|
|
| Source: CQG Integrated client |
Regards,
 |
Murray Dawes,
For Money Morning
PS: Four Well-Positioned Small-Cap Stocks — These innovative Aussie companies are well placed to capitalise on post-lockdown megatrends. Click here to learn more.


Comments