
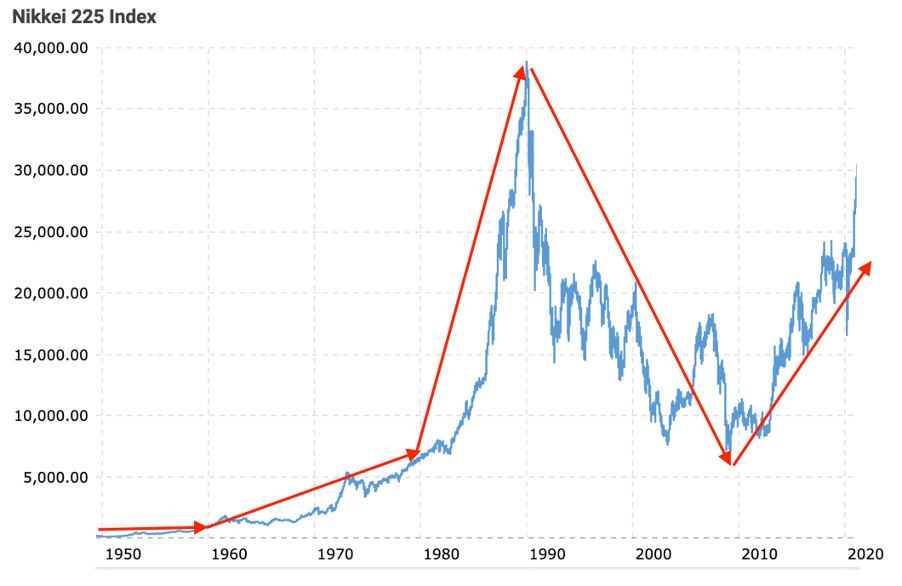
In 1960, the Nikkei 225 and the Dow Jones were at similar starting levels.
The Nikkei 225 began the year at 1,000 points, and the Dow Jones Index was around 700 points.
But, after that, it was a tale of two indices.
While the US future labour force was making its way out of the labour ward, Japan’s share market was making its way to much higher levels…steadily at first, then exponentially:
|
|
| Source: Macrotrends |
Whereas the Dow, well, it was stuck in that sub-1,000-point range for more than two decades.
And, when the Nikkei surged to almost 39,000 points in late 1989, the Dow was nudging a mere 2,500 points:
|
|
| Source: Macrotrends |
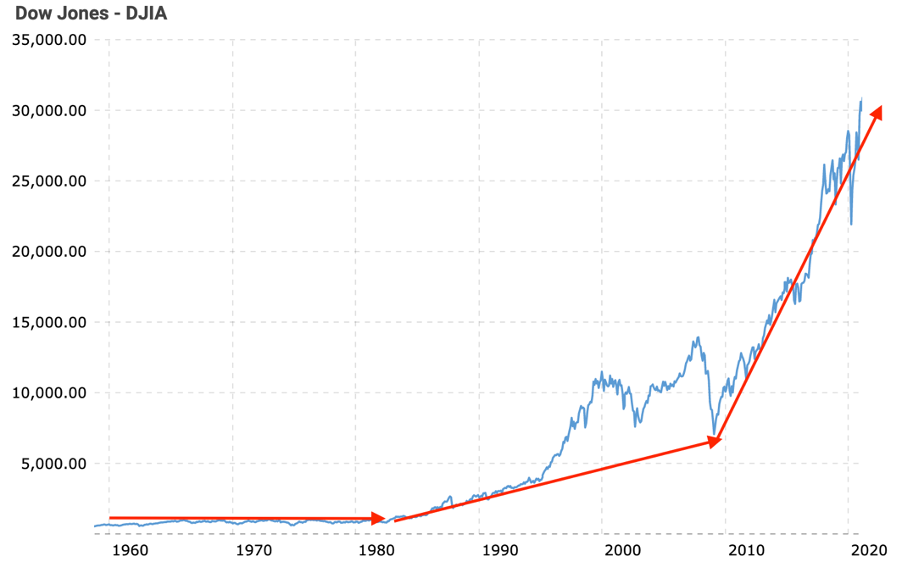
Then, the Dow played follow the leader.
Repeating an all too familiar pattern…steadily at first, followed by the exponential.
Trends take time (years, decades, and even centuries) to evolve…but what usually happens at the end of a very long trend is a hastening of action borne from conviction.
Society becomes so convinced that what they’re experiencing is a permanent state of affairs. What has been will continue to be so.
Time marches on and so do the dynamics that were instrumental in creating those (as we know it, transitory) state of affairs.
It’s taken decades for the debt and demographic trend in the US to reach a turning point.
Japan’s post-1990 experience provides an insight into the fate that possibly awaits over-overvalued asset markets.
In the end, valuation DOES matter
Prior to the recent downside action on Wall Street, 3EDGE Asset Management — a Boston-based quantitative fund manager — provided a prescient research report.
For the technically minded, this is an explanation of the methodology used to determine the US market’s valuation status (emphasis added):
‘Assessing valuation depends upon making estimates about an equity market’s future earnings streams and discount rates. Without a crystal ball or clairvoyant to help, reasonable assumptions need to be made about how earnings are expected to grow over time and the appropriate cost of capital or discount rate to use. After estimating earnings growth using reasonable assumptions while assuming mean reversion of profit margins over time, the valuation assessment becomes highly dependent upon the discount rates applied to the estimated earnings streams over the short and long term.
‘Employing an equity valuation model that discounts the S&P 500 Index’s earnings stream many years into the future, we have calculated that the only way to conclude that today’s U.S. stock market is fairly valued is to assume that today’s ultra-low corporate bond yields (among the lowest in history) remain at current levels forever. Given the unlikelihood that corporate bond yields remain at ultra-low levels forever, if we make what we believe is a more reasonable assumption that interest rates remain at ultra-low levels for the next 20 years then revert to their long-term mean…’
Based on the firm’s valuation model, in late 2021, the US market was in rarefied territory:
|
|
| Source: 3EDGE |
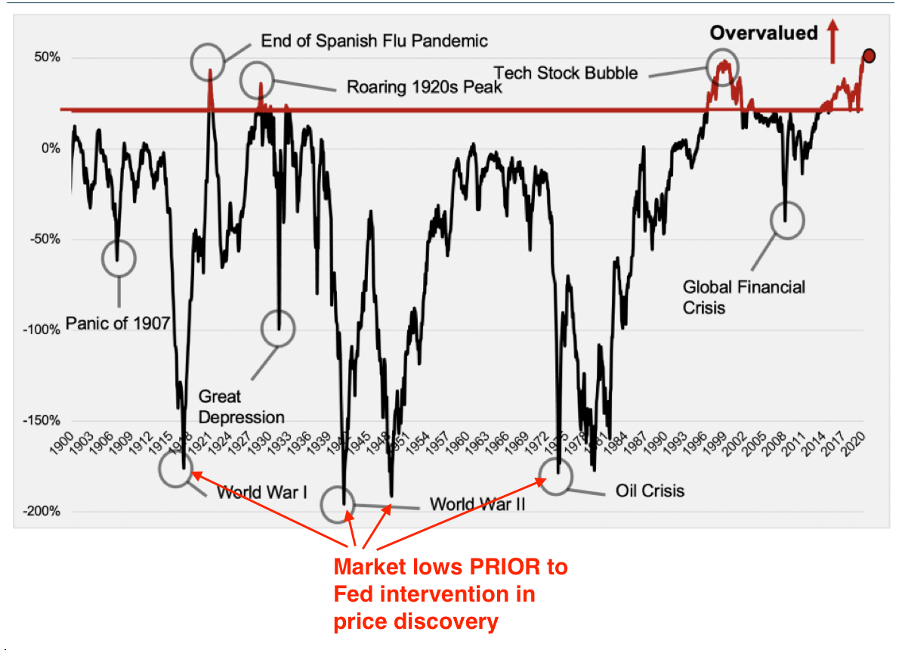
The episodes in US market history when valuations venture into overvalued territory are, indeed, rare.
And, when they do, they never stay there.
Contrary to popular opinion, historical precedent indicates things don’t bode well for the current market.
The other interesting point about this chart is how far the US market corrected PRIOR TO the Fed’s active meddling in the price discovery process.
The GFC correction was — thanks to the Fed — nowhere nearly as ‘cleansing’ as it should have been.
Some will say, ‘this proves the Fed can and will backstop markets’.
Perhaps.
However, by not taking your medicine when you should, have things been set-up for an even bigger fail?
Will the next downturn come with such force; the Fed is incapable of holding back the tide of panicked selling?
I think so.
And, if I’m correct, then the cushioned downside market action we’ve seen in our investing lifetimes has given us a false sense of security.
This is why the prospect of a 70%-plus fall seems so ridiculous…but that’s only because we’ve never experienced such an event.
In the end, valuations DO matter.
The trend in bubble busting
The 3EDGE report included this comparison with the Japanese share market (emphasis added):
‘In contrast, the Japanese stock market is fairly valued using the same valuation approach. This is not surprising; Japanese stocks were highly overvalued during the 1980s, peaking at the beginning of 1990. A brutal bear market ensued, dropping Japanese equities over 80% from their peak. The appetite in Japan for investing in stocks largely disappeared for decades, and Japan’s Nikkei 225 Price Index is still about 25% below its peak of over 30 years ago.’
Shares have been our go-to asset class for so long, the prospect of equity markets being shunned for decades is…inconceivable.
As crazy as the notion of shares being abandoned by a whole generation of investors might sound, remember, markets ALWAYS move in cycles.
In his extensive research on the rise and fall of empires, Ray Dalio observed (emphasis added):
‘… going from one extreme to another in a long cycle has been the norm, [is] not the exception—that it is a very rare country in a very rare century that doesn’t have at least one boom/harmonious/prosperous period and one depression/civil war/revolution, so we should expect both.
‘Yet, I saw how most people thought, and still think, that it is implausible that they will experience a period that is more opposite than similar to that which they have experienced.’
Human nature is why the patterns, down through the ages, are so repeatable.
While the US and Japan are not a perfect overlay, the similarities in debt funded economic ‘success’; transitioning out of the demographic sweet spot and the exponential asset pricing phase that comes with trend extrapolation, are too great to ignore.
In my opinion, the US is going to continue to play follow the Japanese leader.
Which is why a 60%, 70%, or even 80% collapse on Wall Street will come as no surprise.
The only unknown is…how long it takes.
Will it take two decades for the ‘loss of share investing appetite’ trend to exhaust itself?
I don’t know.
But the cleansing process has begun…and, if the Nikkei 225 is any guide, is far from finished.
The bursting of bubbles tends to commence in a similar fashion. An initial rout of 20–25%:
|
|
| Source: Macrotrends |
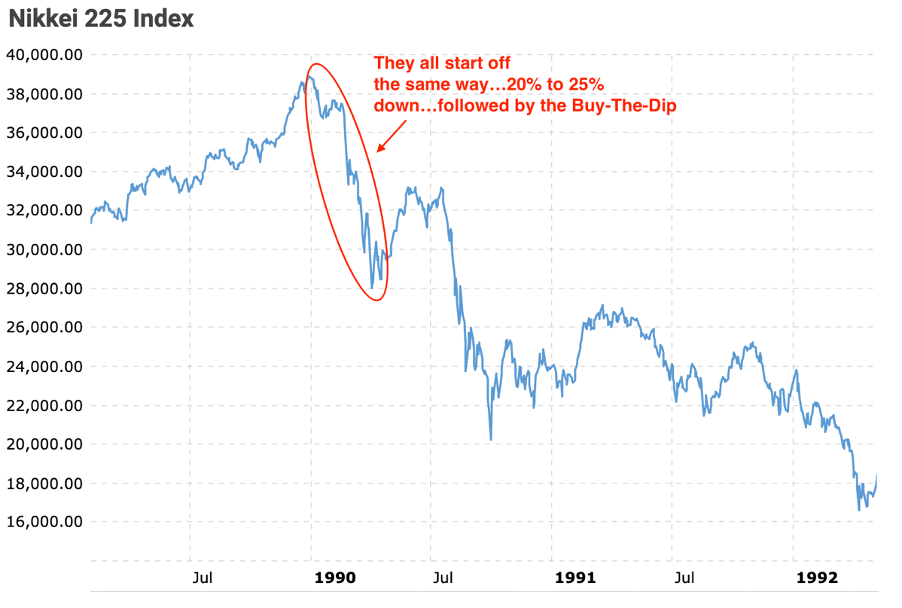
Then comes the clarion call from the perma-bulls…buy the dip. There’s the inevitable bounce. We’re told ‘the worst is now behind us…onwards and upwards’.
Little do investors realise what lies ahead.
People fail to recognise that the cycle has turned from bull to bear. Debt growth slows. Defaults increase. A deflationary consumer mood takes hold. A newfound restraint replaces wanton consumerism.
We are moving into the contraction phase of the cycle.
The 150-year barometer on social mood
The Shiller PE 10 Ratio is one of best barometers we have on changes in social mood (moving from fear to greed to fear).
The emotional ebb and flow of investors is captured in the expansion and contraction of the multiple paid for earnings since 1870.
The 150-year average of the Shiller PE 10 is around 15 times…the rational level.
However, investors rarely act rationally.
|
|
| Source: Multpl |
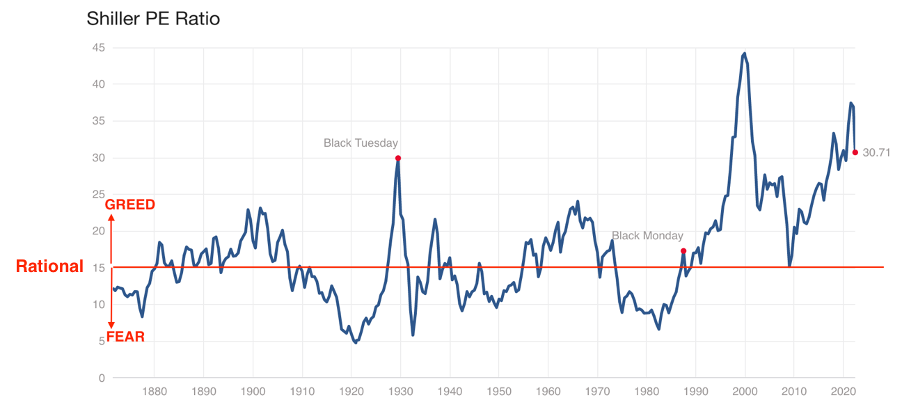
The return to rationality has started with the recent downside action on Wall Street…but there’s still a long way to go.
As the long overdue wealth destruction process gathers pace (and, intensity), deflation NOT inflation is likely to be Public Enemy Number One.
Baby boomers beware
I’ll leave you with a thought from the graph that inspired this two-part series:
|
|
| Source: knoema.com |
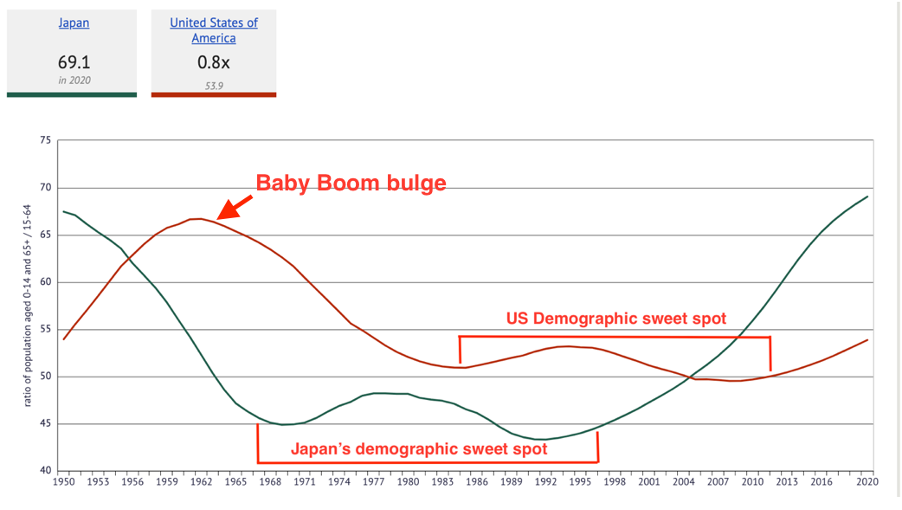
That Western world baby boom bulge is now moving its way into retirement…at precisely the time when the primary wealth creator of boomer retirement capital (shares) is poised to spring a very nasty cyclical about-face.
The choices we make today are likely to have a profound impact on the trend each of our lives take in the coming years and decades.
Regards,
 |
Vern Gowdie,
Editor, The Daily Reckoning Australia
