I have no interest in trading shares.
Spending countless hours studying balance sheets to identify undervalued companies is not my thing.
Cryptos…well, say no more. I don’t understand them and can’t comprehend how you can put any sort of meaningful value on them…pricing is only determined by belief in the unbelievable.
The backyard I’m most comfortable playing in is long-term trends.
In a world of instant-everything, waiting patiently for trends to play out is definitely not most people’s cup of tea.
And that’s completely understandable.
There’s so much content vying for our attention these days.
Taking time out to ponder the shifting patterns of society is a luxury few can afford.
However, those trends are what influence the economy and financial markets.
At the risk of repeating myself one too many times, the 20th century was like no other century in history.
From 1900–99 so much changed…and most of it in the second half of the 20th century:
- Population growth on an unprecedented scale (due to lower infant mortality rates, baby booms, and longer life expectancies).
- Industrial Revolution leading to the technology revolution.
- Quantum leaps in medical science.
- The sophistication of financial markets.
- Fractional banking.
- Women entering and remaining in the workforce.
- Expansive welfare systems.
- Pension funds.
This list could go on and on. But I’m sure you get the gist.
What we take for granted as ‘normal’, is, in the context of history, far from normal.
The society we know today has largely been a construct of the past 70 years.
The problem is the 21st century now has to deal with the legacies from the 20th century:
- An ageing population.
- Unfunded welfare commitments.
- Society’s increased expectations to a certain standard of living (irrespective of whether we can afford it or not).
- Declining birth rates.
- An economy caught in a massive debt trap.
The land of the ageing population
The demographic and debt trends responsible for creating these less-than-favourable legacies are on the cusp of changing.
Japan has been the Western world’s ‘canary in the demographic and debt mine’.
We know from Japan’s experience; the metamorphosis process can be long and (financially) painful.
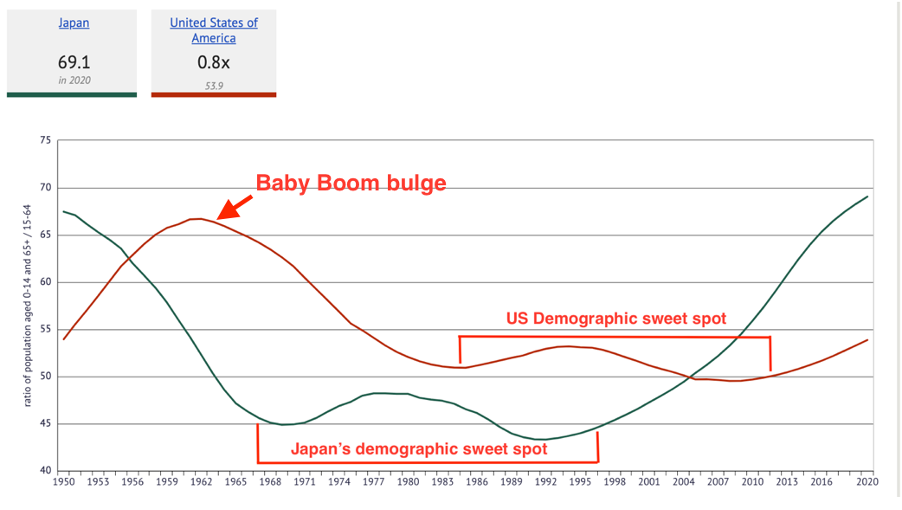
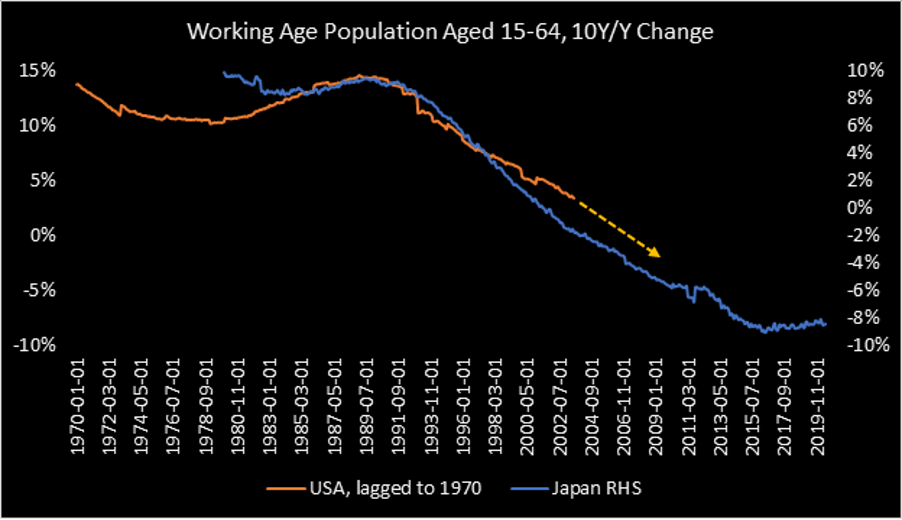
The following chart compares the demographic trend in the ‘Land of the Ageing Population’ with the US.
Japan’s demographic sweet spot (when the ratio of non-working-age citizens was lower than the working-age cohort of over 15s and under 65s) was the key driver behind Japan’s economic glory, especially in the 1980s:
|
|
|
Source: knoema.com |
Courtesy of the demographic sweet spot — with a greater percentage of society in the peak earning age bracket — households borrowed and borrowed some more.
People became conditioned by the onwards and upwards trend (and narrative) in the economy and asset markets.
Past success was destined to continue, uninterrupted, into the future.
Failure to understand the role demographics and debt played in Japan’s financial ‘success’ meant people fell for ‘Investing Mistakes 101’…overconfidence in an overhyped market.
80/20 rule…lose 80% over 20 years
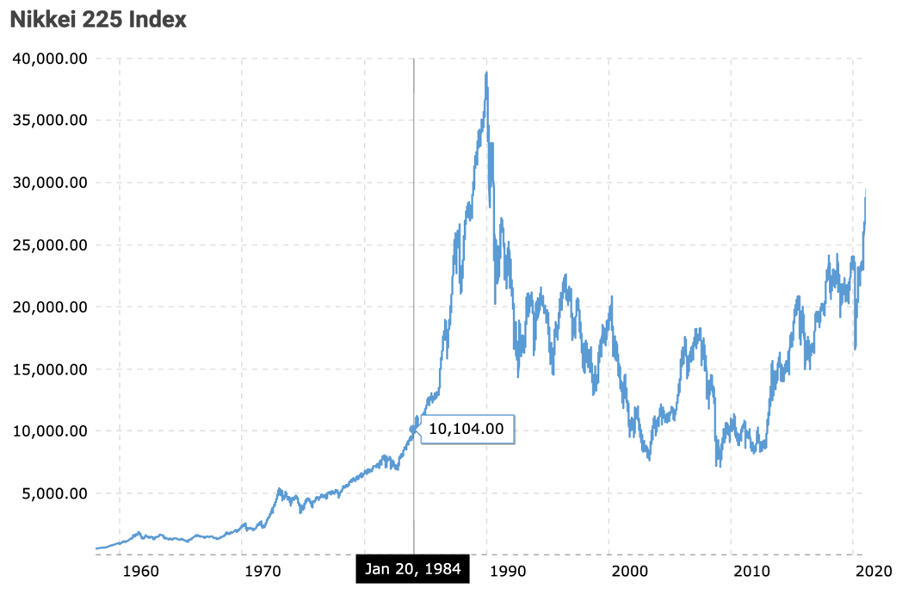
From 1984–89, the Nikkei 225 Index soared fourfold…rising from 10,000 to almost 40,000 points:
|
|
|
Source: Macrotrends |
From its late 1989 peak to the 2009/10 trough, the Nikkei would lose 80% of its value…wiping out 30 years of gains.
When Japan’s ratio of non-working-age population to working-age population began to increase, sustainable economic growth became a distant memory…a forlorn ideal from glory days past.
The US is now where Japan was 25–30 years ago.
Is this slowing economic growth trend going to impact the US in the same way?
USA today
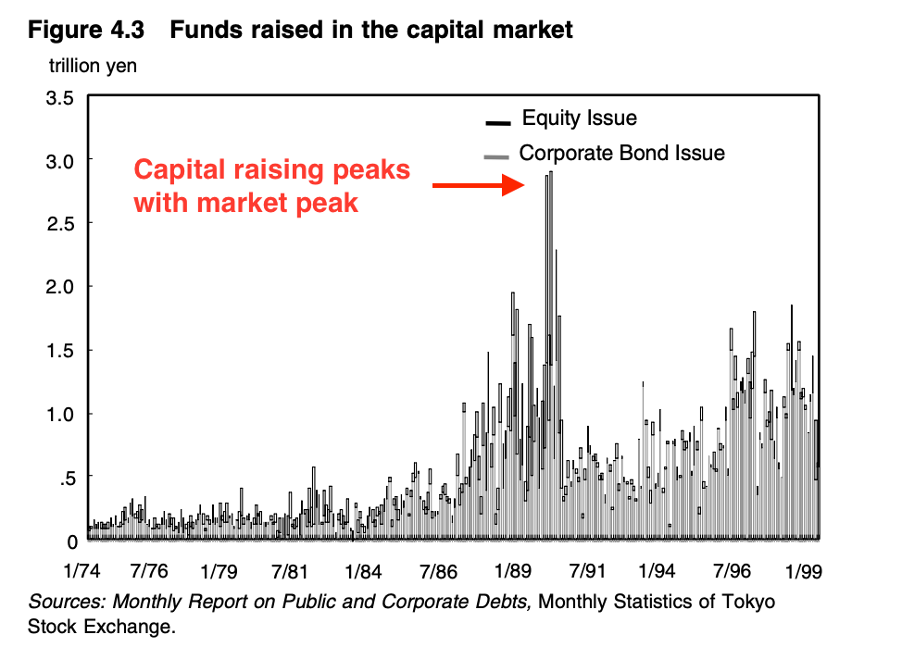
A key driver behind the surging Japanese share market was identified in a research paper from the Institute for International Economics (emphasis added):
‘The Japanese financial market in the second half of the 1980’s was most evidently characterized by a rapid increase in capital market fund-raising by corporations…Figure 4.3 shows the movement of fund-raising in the Japanese capital market and its growth rate relative to the same month of the previous year.’
|
|
|
Source: Institute for International Economics |
Looks and sounds awfully familiar, doesn’t it?
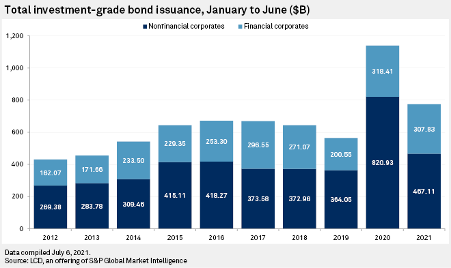
From S&P Global in July 2021:
|
|
|
Source: S&P Global |
Issuance of corporate debt ramps up as the boom closes in on its peak:
|
|
|
Source: S&P Global |
Trends produce repeatable patterns of behaviour.
People rarely question whether the conditions that created past economic and/or financial success are still in play or not. They just run with the crowd.
Towards the end of a long-term trend, confidence in the continuation of the good times is reflected in over-asset prices and an escalation in greed by individuals and corporates.
The Nikkei 225 rose fourfold over a six-year period.
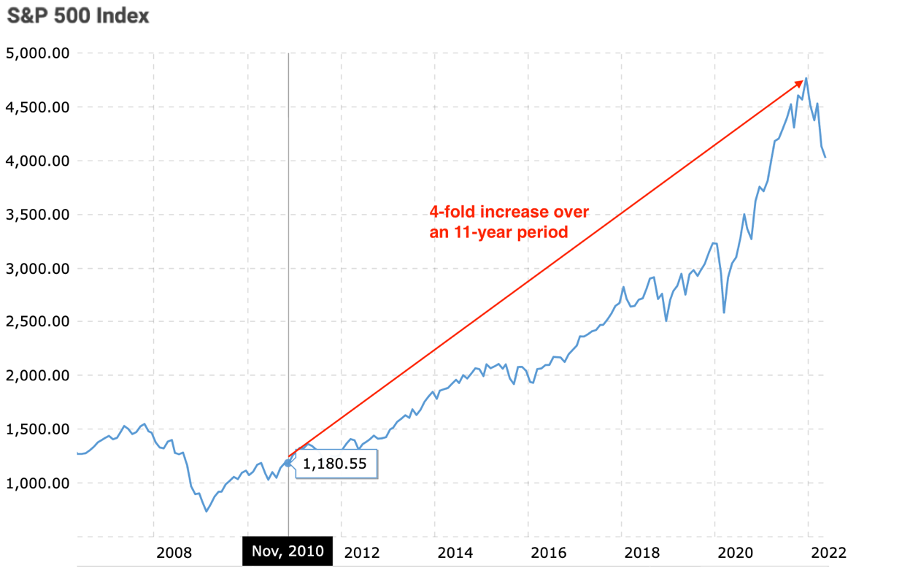
The S&P 500 Index’s fourfold increase has been over an 11-year period:
|
|
|
Source: Macro Trends |
Not quite identical to the Nikkei’s final hurrah, but still an impressive display of collective herding around the trend.
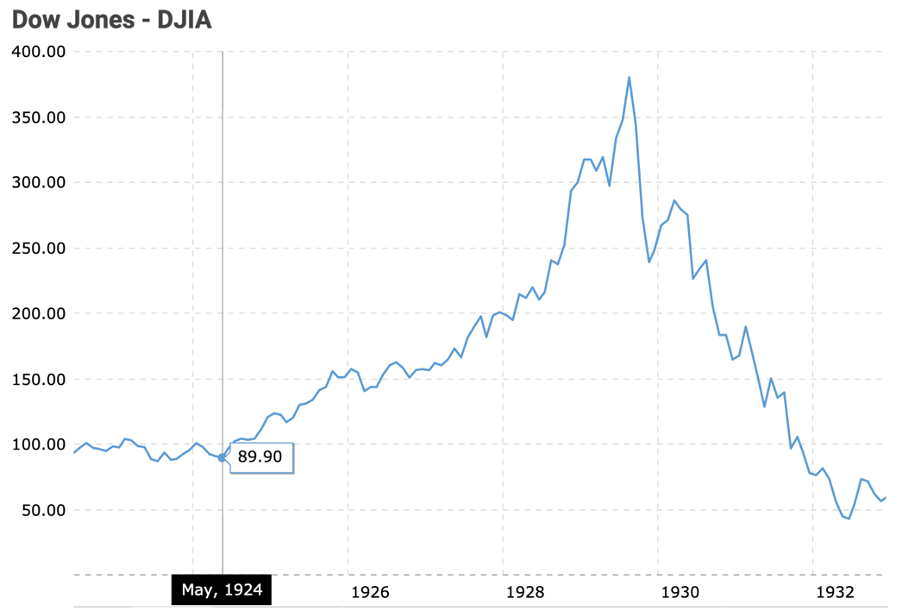
For your consideration, another impressive fourfold increase in a relatively short time frame occurred during the 1920s…just saying:
|
|
|
Source: Macrotrends |
Like Japan, the 1920s burst of asset price inflation was followed by an 80%-plus market fall.
Forward-looking investors should take serious notice of these two precedents.
The comparisons continue
The souring of Japan’s economic sweet spot was instrumental in its economic stagnation and asset (shares and property) price declines.
The US is on the same pathway:
|
|
|
Source: Blackbeard Research |
The demographic trend is no longer the economy’s or financial market’s friend.
To make matters worse, the participation rate of the (declining) working age (labour force) cohort is also declining from its sweet spot highs:
|
|
|
Source: Federal Reserve Economic Data |
These two negatives don’t make a positive…there are fewer people working to pay for the (very expensive and unfunded) legacies of the 20th century.
Based on Japan’s debt and demographic experience, the US economy (and financial markets) is facing tough times ahead.
Naturally, very few people think this is what the future holds.
The majority see a continuation of the trend…albeit with the occasional bump.
Until late 2021, the US share market was behaving similarly to the Nikkei 225 Index in 1989…new high after new high…until the bell rang.
Is the US market destined to follow 1929 Wall Street and 1989 Tokyo?
Stay tuned for Part Two next week.
Regards,
 |
Vern Gowdie,
Editor, The Daily Reckoning Australia

