
Dear Reader,
I had an interesting question from a reader a few weeks ago:
‘Hi Catherine, I read your last article and watched your interview with Greg Canavan.
‘You mentioned that in the last 3 cycle downturns [sic], there hasn’t been anywhere the value decreased more than 15-20%.
‘The biggest downturn was during the recent slump in 2017-2018 which was around 10%.
‘So that means at the peak of the cycle it never exceeded that number. So why is that and what’s the point of worrying about the peak?
‘I understand that 10% was a national average where some areas might fall further than that.
‘I am always struggling to picture what the peak of the cycle looks like in terms of the decrease in value…’
Shifts in the median price hide a lot.
After all, the median is just the middle number of a bunch of sales.
If the top end of the market falls sharply (as in most downturns), the median will come down somewhat — but the actual fall in property prices can be far more apparent.
Take this recent downturn through 2022.
The change in median values from peak to trough wasn’t all that substantial.
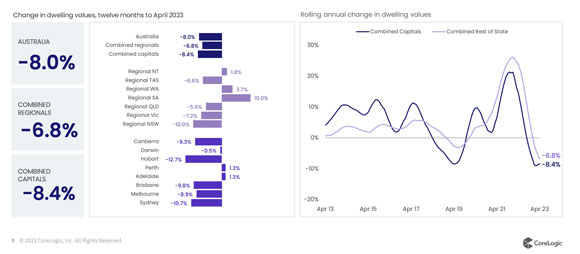
Down 8.40% nationally.
Below is the breakdown per city (and regional areas) over the past 12 months:
|
|
| Source: CoreLogic |
However, the change in actual property prices was far more pronounced — particularly for some sectors of the market.
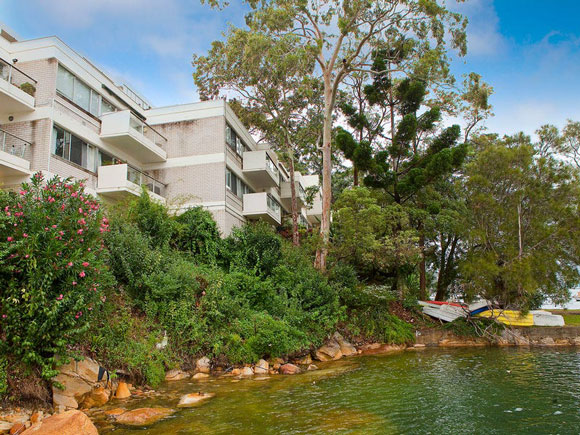
For example, I assisted a vendor in mid-2022 who owned a premium two-bedroom apartment in McMahons Point, Sydney.
A beautiful, renovated, established apartment — flooded with natural light and overlooking the bay.
|
|
| Source: realestate.com.au |
At the end of 2021 and beginning of 2022, prices on some apartments in the complex were nearing (and in some cases exceeding) $2 million.
|
|
| Source: Pricefinder |
|
|
| Source: Pricefinder |
A few months later however, large discounts were needed to secure a sale.
|
|
| Source: Pricefinder |
The vendor was initially told (by the sales agent) that he could achieve more than $2 million.
However, the reality was woefully different.
A significant price drop was required — more than 20% from initial expectation.
A painful process.
I can cite numerous other examples at the top end of the market, outside of the apartment sector — but for the sake of brevity, hopefully, you get the idea.
It’s why you need to be wary of articles in the mainstream media that cite median falls and then use an individual property as an example of what to expect.
There were many articles amid the downturn in 2022 that did just this!
This one from news.com.au, for example:
|
|
| Source: news.com.au |
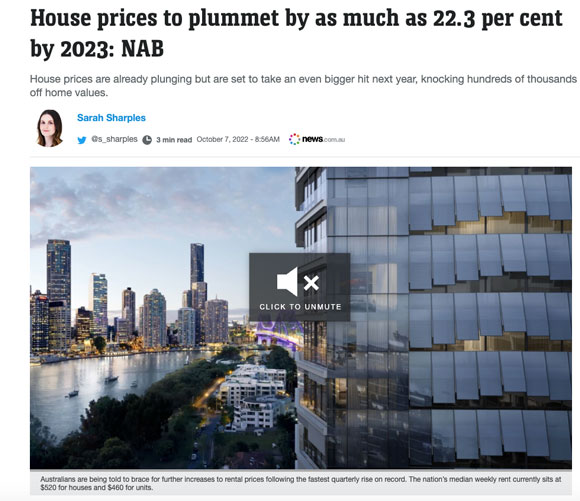
‘This will see house prices plummet by 22.3 per cent overall in one of Australia’s most expensive housing markets, knocking off a whopping $345,000 for a house that costs $1.55 million.’
If the national median had in fact dropped by more than 20% (something that has not been recorded nationally since the Great Depression in the 1930s — and would not have happened at this point in the cycle), it would have knocked far more off the price of a $1.55 million home than 22.3%.
So, what does an end-of-cycle downturn look like on individual property prices?
Let’s scoot back to the early 1990s downturn in Melbourne — the most severely affected capital.
It should have been expected.
UK economist Fred Harrison warned of the collapse eight years in advance in his 1883 book, The Power in the Land.
He forecast that without reform, Western economies would be ‘tail-spinning into yet another deep-seated depression of even greater magnitude’18 years from ‘the structural recession that began in 1974’.
1992 being the date of significance.
This happened in the UK, Europe, the US, and of course, Australia.
Melbourne’s residential real estate market exploded in the lead up to the peak of 1989 — median gains accelerating faster than we witnessed during the recent 2020–21 inflationary period.
Many investors, both domestic and international, were attracted to Melbourne’s property market. Speculation became rampant — investors threw dollars into real estate, expecting prices to continue rising indefinitely.
The boom also resulted in huge surges in construction activity. Numerous residential and commercial projects were initiated to meet demand.
However, it also resulted in oversupply in some areas, further exacerbating the devastation when the market finally turned.
To be clear, the commercial market suffered far more than the residential market. The median price dropped some 50% (or 60% in real terms).
The median fall in residential property prices was recorded at around 10% (peak to trough).
That doesn’t sound like a lot.
However, as with the example above, the effect on some individual property prices was far more pronounced!
Take a look at a couple of examples below.
These are properties that were purchased at the peak (as per the dates in the right-hand column) and sold a few years later in the downturn as the market bottomed.
As you can see, the drop in individual prices was more than 40% in some instances.
|
|
| Source: PDOL (property data online REIV) |

The recession was significant, leading to a wave of business failures and bankruptcies in Melbourne.
Many companies across various sectors struggled to survive due to dramatically reduced consumer spending, plummeting demand, and financial strife, resulting in further job losses along with strikes and industrial action by workers.
Prices were depressed for a number of years, until around 1995–97 — before stock dropped and the property market finally started to turn.
So, in short, timing the market with knowledge of the cycle does matter!
And as I said above, the median falls (or rises) nationally can under or overestimate what is happening on the ground.
Just as we saw some individual properties gain 40–50% through the 2020–21 boom despite the median uplift showing sub-30% gains.
Of course, the above examples can differ significantly depending on what type of property you purchase (which is just as important as the location you purchase it in!)
A poor investment can run sideways through a boom for years, barely gaining value before taking a significant hit in a downturn.
It’s important also to note the difference at the end of the cycle compared to mid-cycle peaks and troughs — like saw in the real estate market in 2018 and 2022.
At the end of the cycle, the market will likely be flooded with foreclosures.
Economic conditions will be harsh, featuring high unemployment rates, severe restrictions on gaining finance, and the economy in a recession that — as witnessed in the 1990s — can take the property market years to recover (without government intervention, that is).
This is not what we are currently seeing.
Stock remains low, immigration is rising to record levels, rents are still rising in most regions with record-low vacancy rates, and unemployment remains very low.
Under current conditions, we’ll likely see a boom through 2024–26.
Subscribers to Cycles, Trends & Forecasts have access to knowledge that demonstrates how to precisely time the cycle, advantage through the boom, and hedge against the bust.
Until next time.
Best Wishes,
 |
Catherine Cashmore,
Editor, Land Cycle Investor

Comments