‘Dishonest scales are an abomination to the Lord. But a just weight is His delight.’
Proverbs 11:1, New King James Version Bible
Tuesday, 1 June. The start of a new month. Most people go on with their daily lives.
Not so if you work in a bank or as a news reporter.
All eyes are on the Governor of the Reserve Bank of Australia (RBA), Philip Lowe, and the monetary policy statement released at 2:30pm.
The 24-hour cash rate is unmoved at 0.1%.
This rate is perhaps the most powerful number in our economy. It drives what we receive in our term deposits and what we pay for our home and car loans. Businesses make investment decisions based on this number.
The second paragraph of the official statement is ironic. Let me reproduce it here (emphasis added):
‘The global economy is continuing to recover from the pandemic and the outlook is for strong growth this year and next. The recovery remains uneven, though, and some countries are yet to contain the virus. Global trade in goods has picked up strongly and commodity prices are mostly higher than at the start of the year. However, inflation in underlying terms remains low and below central bank targets.’
I find it strange that they can say global trade in goods picked up strongly, commodity prices are higher, yet inflation remains low…
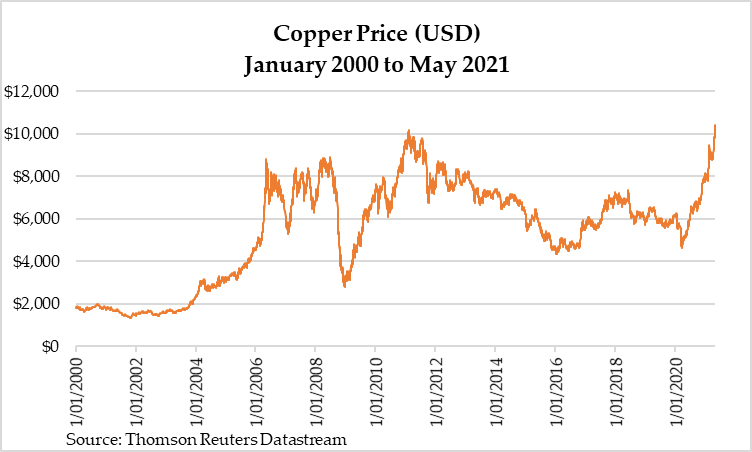
The very fact that prices are rising as trading activity picks up means there is inflation! Moreover, the price of copper has hit all-time record highs. Copper is one of the best indicators of inflation. The market calls it Dr Copper for that reason.
Look at the chart below for the price over the last 20 years:
|
|
|
Source: Reuters |
The price of copper has doubled since last March. It is impossible to imagine this will not feed through to our economy. After all, copper is an essential input.
The reason why central bankers see inflation remaining low is because of the way they play with data.
Go to the RBA website and you will see that their inflation rate is 1%.
Meanwhile, the Australian Bureau of Statistics published the March 2021 quarter Consumer Price Index showing it rose 1.1% for the quarter!
Things don’t add up. I will cover this in more detail next week.
Let’s revisit monetary policy and how the central banks try to control inflation.
Central banking and price control
You can find the RBA’s monetary policy statement on their website. Here’s an excerpt (emphasis added):
‘The Reserve Bank is responsible for Australia’s monetary policy. Monetary policy involves setting the interest rate on overnight loans in the money market (“the cash rate”). Since 2020, the Reserve Bank has put in place a comprehensive set of monetary policy measures to lower funding costs and support the supply of credit to the economy. These measures affect the behaviour of borrowers and lenders, economic activity and ultimately the rate of inflation.’
Notice how the RBA statement does not talk about economic growth? They care about debt, economic activity, and inflation.
Economic activity means spending. Productive spending that leads to wealth creation is a different matter.
Furthermore, the RBA has snuck into that statement about how they ‘support the supply of credit to the economy’. They are telling us they’re creating more debt in the economy.
Debt creates inflation. Banks create debt and then attach interest onto that debt.
So, what is inflation?
Inflation is the increase in price levels. If the economy creates dollars faster than goods and services, prices rise.
As prices rise, people’s purchasing power falls. They need to earn more to buy the same thing or make do with less. People also resort to more borrowing to make ends meet.
The RBA imposed inflation targeting in the early 1990s to try to control inflation. They did this by setting the interest rate in order to keep inflation at 2–3% pa.
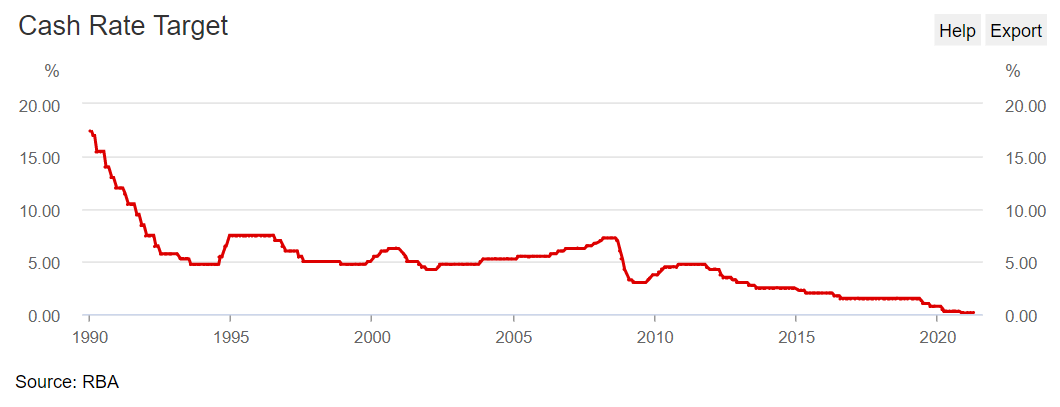
Let’s briefly examine how price fixing has affected our economy. The figure below shows the RBA rate over the last 30 years:
|
|
|
Source: RBA |
The RBA rate fell from 1990 to 2000. It rose into the subprime crisis that began in late 2007. After the crisis, the RBA cut the rate further. It now sits at an all-time low of 0.1%.
Now, what about inflation?
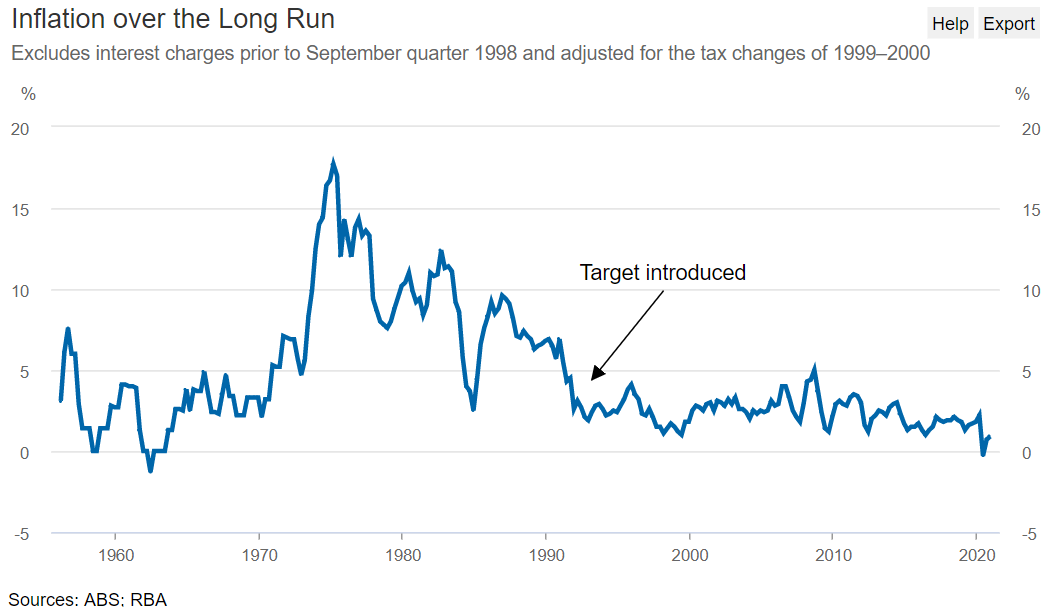
The figure below shows the inflation rate from the 1950s to now (note the RBA-implemented inflation targeting in the early 1990s to try to solve the problem):
|
|
|
Source: RBA |
Since the RBA introduced inflation targeting, the graph appears to suggest they have inflation under control. They tell you they’ve done it because inflation is pretty much below 5%.
What they have under control is our perception and trust. They have conned us.
Stay tuned next week as I delve into official economic statistics to show you how they attempt to keep this charade going.
Regards,
 |
Brian Chu,
Editor, The Daily Reckoning Australia
PS: Our publication The Daily Reckoning is a fantastic place to start your investment journey. We talk about the big trends driving the most innovative stocks on the ASX. Learn all about it here.


